Skip to content

Silencing Backup Messages with Trace Flag 3226
ErrorLog_flooded

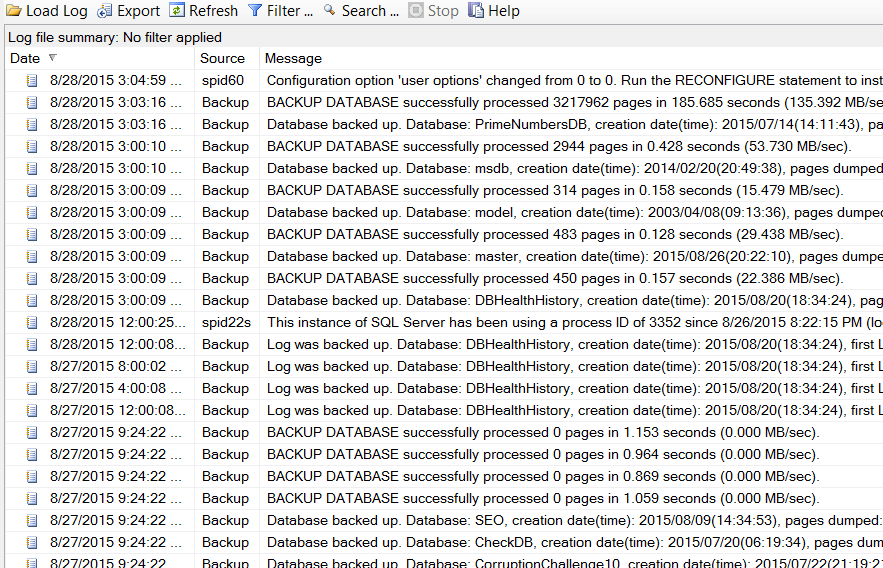
As a DBA you regularly schedule backups you might have regular full backups, incremental backups and hopefully regular backups. Over time you might realize that your error log is not longer filled with errors, but instead a majority of your error log is filled with backup messages. “Backup Database successfully … “,  “Database backed up…”, “Log was backed up”. This makes it a bit difficult to find the actual errors in this flood of backup messages. Your error log is no longer an error log, but it looks more like a backup log.

Trace Flag 3226

Trace flags in SQL Server are switches or parameters that can be used to turn on or off different features. If you use trace flag 3226 this will turn off all successful backup messages being written to the error log. There are a couple of ways to use trace flag 3226, one is to use DBCC TRACEON to turn on trace flag 3226 for the currently running instance. Using this option will turn it on until the next time the database instance is restarted.

Read More »Silencing Backup Messages with Trace Flag 3226
SQL Server Mentoring – Now Available

Yesterday I was asked by a client about consulting questions and for my help without the typical minimum hourly commitment. He pointed out that he has things that he could use help with that don’t require a multi-hour type project. After thinking it over a bit, I decided to add a SQL Server coaching program to my consulting business, I am calling it my SQL Server Mentoring program.

SQL Server Mentoring Process

Here is how it works if you want to utilize my mentoring services.

Step 1:  Set up a mentoring agreement. You can start this with the free 30 minute consultation form to schedule a time to talk to better understand the service, and so that I can better understand your needs and environment.

Read More »SQL Server Mentoring – Now Available

SQL Server Database Corruption Repair

Database corruption repair with SQL Server is one of those things that you generally don’t see every day, but as a DBA, you are expected to be able to fix it quickly without any data loss. From the risk analysis matrix, it is one of those low frequency high impact scenarios that results in an extremely risky situation. This is one of those situations which could lead to great success, or massive failure depending on your training and skills.

These low frequency, high impact, high risk scenarios are the times that you need to rely on your training, or the training of someone more experienced in these areas.

Read More »SQL Server Database Corruption Repair

What is a Page Split

Tables, and indexes are organized in SQL Server into 8K chunks called pages. If you have rows that are 100 bytes each, you can fit about 80 of those rows into a given page. If you update one of those rows to have more data that contains a variable length field like VARCHAR, NVARCHAR, and others, that will cause the page to overflow forcing a page split. The page split takes about half of the data and moves it into a new page, leaving about half in the original page. Another action that causes a page split is to insert a row that based on the indexing would go into a page that is nearly full, if the inserted row doesn’t fit a page split occurs.

If there is room, and your update or insert doesn’t require a split, this is pretty quick to do since SQL Server is just updating one page and then writing it to disk, and to the transaction log. But if the updated or inserted row doesn’t fit, SQL Server needs to allocate a new page, move about half the rows, and then write both pages to disk and to the transaction log. Additionally the pages in all the indexes that point to the data pages need to be updated. Let’s say your table had 1 clustered index, 4 nonclustered indexes, at a minimum 7 pages would be updated, 1 for the clustered index structure, 4 for the nonclustered indexes, and 2 in the data pages in the clustered index. In this specific example the page split would cause a minimum of 7 times the I/O as an insert or update that didn’t require a page split.

Read More »What is a Page Split

Error Log: I/O is Frozen On Database

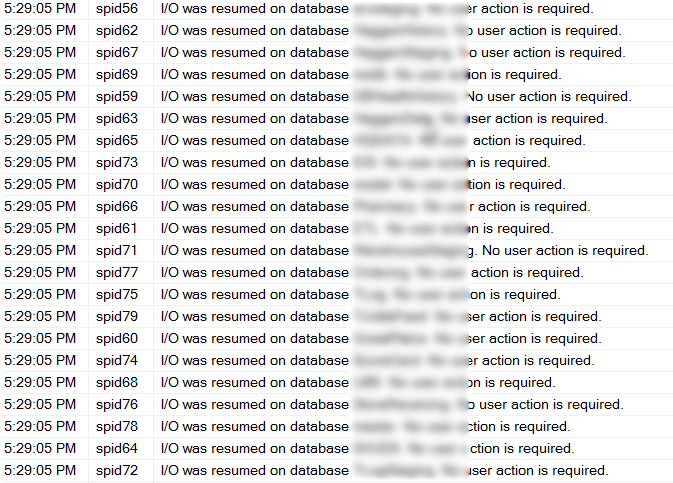
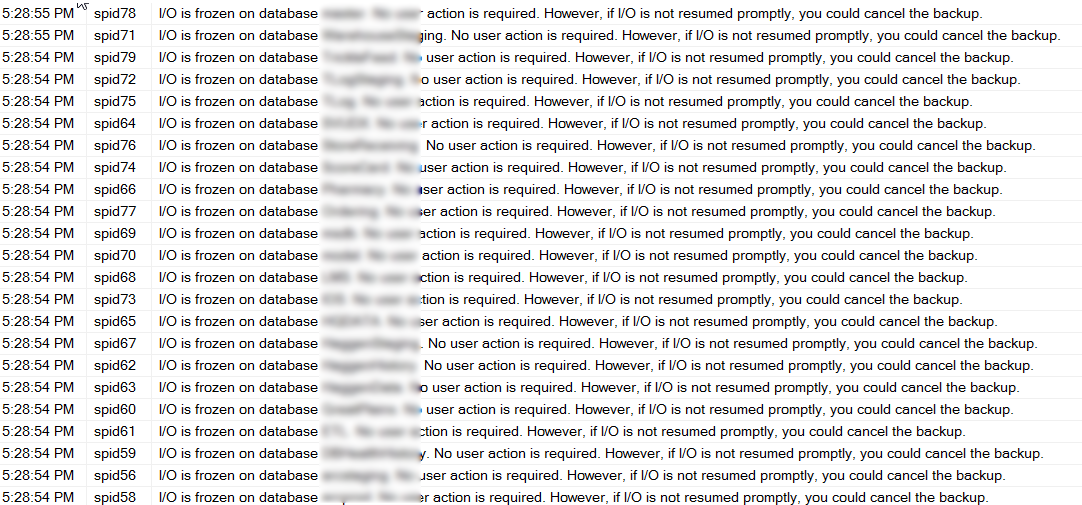
I/O is Frozen on Database. You are scanning your SQL Server Logs and discover the following error messages. There may be a long list of them, one frozen and one resumed for each database on your SQL Server.

I/O Is Frozen On Database

spid61,Unknown,I/O is frozen on database [master]. No user action is required.
spid61,Unknown,I/O is frozen on database [model]. No user action is required.
spid61,Unknown,I/O is frozen on database [msdb]. No user action is required.
spid61,Unknown,I/O is frozen on database [databaseName1]. No user action is required.
spid61,Unknown,I/O is frozen on database [databaseName2]. No user action is required.
spid61,Unknown,I/O was resumed on database [master]. No user action is required.
spid61,Unknown,I/O was resumed on database [model]. No user action is required.
spid61,Unknown,I/O was resumed on database [msdb]. No user action is required.
spid61,Unknown,I/O was resumed on database [databaseName1]. No user action is required.
spid61,Unknown,I/O was resumed on database [databaseName2]. No user action is required.


IO Is Frozen on DatabaseIO Is Frozen on Database

The error message doesn’t sounds good, I/O frozen… Your SQL Server needs its I/O, and how could frozen I/O be anything but bad?

Well it turns out that when Veeam, Veritas, Symantec Business Continuance Volume (BCV) or other third party backup tools that uses a VSS (Volume Shadow Copy Services), it temporarily freezes the I/O, then quickly resumes it. Keep in mind that Veeam for instance is a really awesome tool, that just happens to use a built in SQL Server feature to use snapshots on the backup. Veeam an other backup tools do this to get the most solid backup possible when a virtual machine is being backed up.

Read More »Error Log: I/O is Frozen On Database

Steps to Improve ETL Performance Using SSIS

Some of the biggest performance tuning wins that I have had over my career have been related to performance tuning queries that are being called from SSIS. So often the actual query performance gets overlooked in the SSIS environment. A few years ago I was able to tune a query that was being called from an SSIS package and reduce the runtime of that package from over an hour, to just 2 minutes. Its not always that big of a win, and there are other performance tuning options besides just tuning the queries, so lets take a look at some of them.

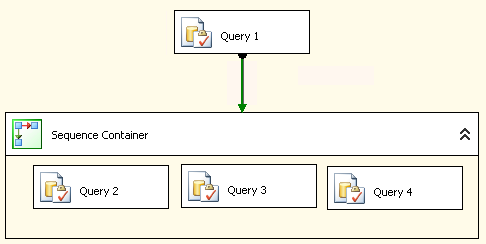
ETL Performance Using SSIS parallel queries.SQL Server Integration Services (SSIS) is one of those components that can help you out with your ETL (Extract, Transform and Load) work, or it can hinder your process if it is a poor performing ETL. There are many things that can easily cause an ETL to run for hours, when it should be running for minutes.

The following tips are intended as things to consider when performance tuning to improve your ETL Performance Using SSIS.

Read More »Steps to Improve ETL Performance Using SSIS

Statistics IO for Performance Tuning in SSMS

Statistics IO and Statistics Time is another SQL Server Performance Tuning Tip to help you better understand performance bottlenecks.

Have you ever wanted to know exactly how long it took for a query to run? Have you ever wondered how many I/O reads or writes were caused by your query? With Statistics IO and Statistics Time you can understand both of these.

Statistics IO for Performance Analysis

This post is on using statistics IO to analyze query performance. There is another post on using Statistics Time for performance tuning.

I usually prefer to use Statistics IO over Statistics Time because the Statistics IO option gives better details on what exactly the query is doing.

Let’s take the following query as an example:

Read More »Statistics IO for Performance Tuning in SSMS

Using Statistics Time for Performance Tuning in SSMS

Statistics IO and Statistics Time are another SQL Server Performance Tuning Tip to help you better understand performance bottlenecks.

Have you ever wanted to know exactly how long it took for a query to run? Have you ever wondered how many I/O reads or writes were caused by your query? With Statistics IO and Statistics TIME you can understand both of these.

Statistics Time for Performance Analysis

This post is on using statistics TIME to analyze query performance. There is another post on using Statistics IO for performance tuning.

Another SQL Server Performance Tuning Tip to help you better understand performance bottlenecks.

This is a simple step to get performance statistics on about any query you are writing in SSMS.

Let’s take the following query as an example:

Read More »Using Statistics Time for Performance Tuning in SSMS