Using Statistics Time for Performance Tuning in SSMS

Statistics IO and Statistics Time are another SQL Server Performance Tuning Tip to help you better understand performance bottlenecks.
Have you ever wanted to know exactly how long it took for a query to run? Have you ever wondered how many I/O reads or writes were caused by your query? With Statistics IO and Statistics TIME you can understand both of these.
Statistics Time for Performance Analysis
This post is on using statistics TIME to analyze query performance. There is another post on using Statistics IO for performance tuning.
Another SQL Server Performance Tuning Tip to help you better understand performance bottlenecks.
This is a simple step to get performance statistics on about any query you are writing in SSMS.
Let’s take the following query as an example:
SELECT *
FROM Orders AS o
	 INNER JOIN
	 Customers AS c
	 ON c.id = o.customerId
WHERE c.LastName = 'HOBBS';
This query is using the database from Database Corruption Challenge #10.
When we run the query it runs pretty quick and as you can see in the following output, it shows the elapsed time was 00:00:00. But we do know that they query had to have taken some time to run.
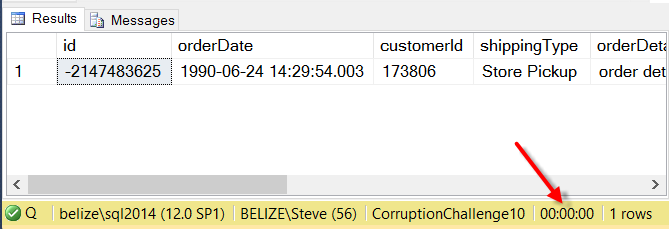
The time a query takes is an extremely useful thing to know, but 0 seconds doesn’t tell what we need. There are some more useful timing and I/O numbers you can take a look at.
First let’s take a look at the time that it took your query to run. The time information includes the number of milliseconds required to parse, compile, and execute each statement. For this we will use the SET STATISTICS TIME ON command in SQL Server Management Studio.
SET STATISTICS TIME ON;

SELECT *
FROM Orders AS o
	 INNER JOIN
	 Customers AS c
	 ON c.id = o.customerId
WHERE c.LastName = 'HOBBS';
Which looks like this…

Which has better information than the query took 0 seconds to run. We now know the SQL Server Execution Times with a CPU time of 31 ms and an elapsed time of 52 ms. What exactly does this mean? The CPU time is the total amount of time used on all processors or cores that were processing the query. The elapsed time is the total time it took to parse the query, execute the query and return the results.
Simple queries like this will typically not be parallelized, but with a parallel query you can get a CPU time several times larger than the elapsed time. Now that you know the exact timing information you can do your performance tuning and be able to tell if you changes are faster or slower than the previous run.
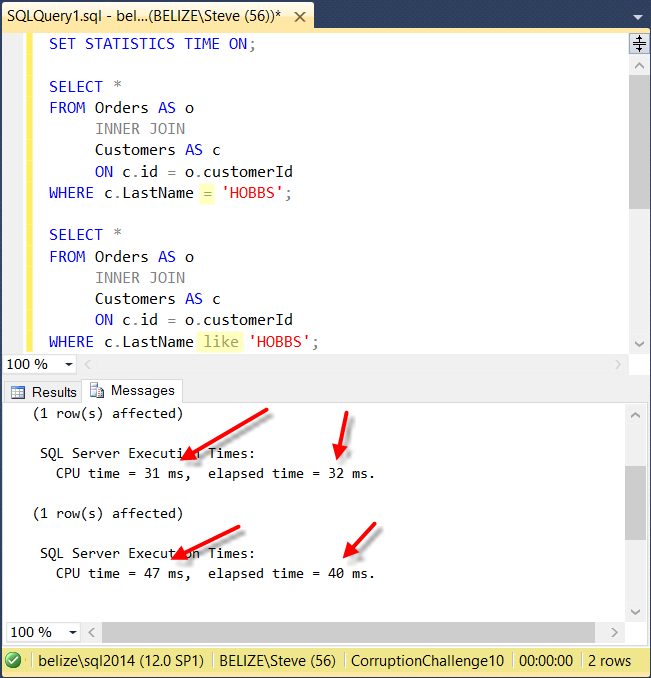
Now to compare two queries with the STATISTICS TIME ON. These are very similar queries the only difference is the customer LastName comparison is done with an equals in one and a like in the other.
SET STATISTICS TIME ON;

SELECT *
FROM Orders AS o
	 INNER JOIN
	 Customers AS c
	 ON c.id = o.customerId
WHERE c.LastName = 'HOBBS';

SELECT *
FROM Orders AS o
	 INNER JOIN
	 Customers AS c
	 ON c.id = o.customerId
WHERE c.LastName like 'HOBBS';
Here you get two lines of output in the messages window showing the statistics time information for each of the two queries. This shows that in this specific scenario the query with the LIKE comparison is slightly slower than the query using the equals comparision.
You can use this as an easy way to compare the elapsed time of two or more queries.
The problem with the Statistics Time option is that if you are running against a development database that is a copy of your production database you may get very different results on the statistics time numbers depending on the load and configuration on those servers. What I like to use instead is the Statistics IO option, which is covered in a separate post.
This post applies to SQL Server 2005, 2008, 2008R2, 2012, 2014 and 2016.
Need Help?
Need help with SQL Server Performance tuning or to just better understand how a query performs Stedman Solutions can help?
Part of the services offered by Stedman Solutions, LLC focus on SQL Server performance tuning. We can help track down and diagnose your SQL Server performance problems. Contact us today for a free 30 minute consultation.

Related Links
- Statistics IO for performance tuning
- Database Health Monitor Download
- Stedman Solutions, LLC
- Performance Tuning on SteveStedman.com
More from Stedman Solutions:

Steve and the team at Stedman Solutions are here for all your SQL Server needs.
Contact us today for your free 30 minute consultation..
We are ready to help!
Leave a Reply