GE Centricity EMR Performance Tuning.
I have been doing work with multiple clients using the GE Centricity EMR product which makes extensive use of Microsoft SQL Server. The performance issues… Read More »GE Centricity EMR Performance Tuning.
I have been doing work with multiple clients using the GE Centricity EMR product which makes extensive use of Microsoft SQL Server. The performance issues… Read More »GE Centricity EMR Performance Tuning.
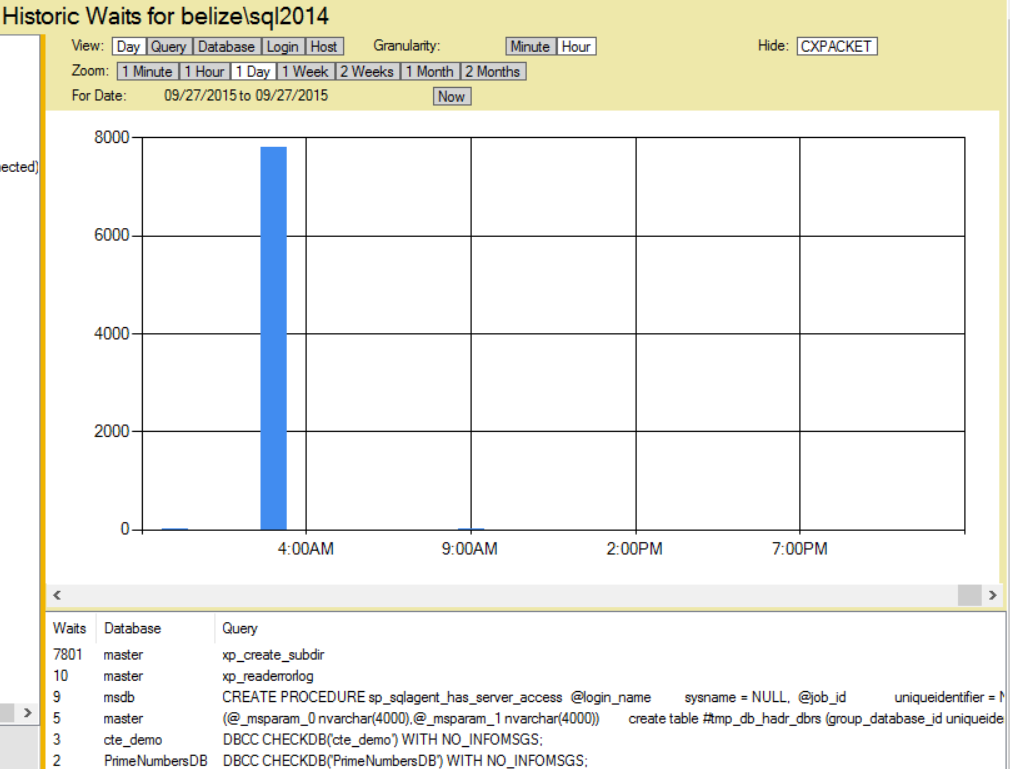
Here is a discovery that I made using the Database Health Monitor historic wait monitoring, on a server with slow storage where the backups were being written.
If you are seeing excessive waits on the PREEMPTIVE_OS_GETPROCADDRESS wait type and xp_create_subdir is the command with the wait, and this is occurring at the time your backups are being run, it is a symptom that the storage location for your backups is having I/O difficulties.

I noticed this on a server with an external USB 2.0 attached hard drive that was being used for backups, and on a second server with a USB 3.0 external hard drive. When the backups run, there was a wait for the process to attempt to see if the backup directory exists, and to create it if it did not.
Read More »PREEMPTIVE_OS_GETPROCADDRESS and xp_create_subdir
Tables, and indexes are organized in SQL Server into 8K chunks called pages. If you have rows that are 100 bytes each, you can fit about 80 of those rows into a given page. If you update one of those rows to have more data that contains a variable length field like VARCHAR, NVARCHAR, and others, that will cause the page to overflow forcing a page split. The page split takes about half of the data and moves it into a new page, leaving about half in the original page. Another action that causes a page split is to insert a row that based on the indexing would go into a page that is nearly full, if the inserted row doesn’t fit a page split occurs.
If there is room, and your update or insert doesn’t require a split, this is pretty quick to do since SQL Server is just updating one page and then writing it to disk, and to the transaction log. But if the updated or inserted row doesn’t fit, SQL Server needs to allocate a new page, move about half the rows, and then write both pages to disk and to the transaction log. Additionally the pages in all the indexes that point to the data pages need to be updated. Let’s say your table had 1 clustered index, 4 nonclustered indexes, at a minimum 7 pages would be updated, 1 for the clustered index structure, 4 for the nonclustered indexes, and 2 in the data pages in the clustered index. In this specific example the page split would cause a minimum of 7 times the I/O as an insert or update that didn’t require a page split.
I/O is Frozen on Database. You are scanning your SQL Server Logs and discover the following error messages. There may be a long list of them, one frozen and one resumed for each database on your SQL Server.
spid61,Unknown,I/O is frozen on database [master]. No user action is required.
spid61,Unknown,I/O is frozen on database [model]. No user action is required.
spid61,Unknown,I/O is frozen on database [msdb]. No user action is required.
spid61,Unknown,I/O is frozen on database [databaseName1]. No user action is required.
spid61,Unknown,I/O is frozen on database [databaseName2]. No user action is required.
spid61,Unknown,I/O was resumed on database [master]. No user action is required.
spid61,Unknown,I/O was resumed on database [model]. No user action is required.
spid61,Unknown,I/O was resumed on database [msdb]. No user action is required.
spid61,Unknown,I/O was resumed on database [databaseName1]. No user action is required.
spid61,Unknown,I/O was resumed on database [databaseName2]. No user action is required.
The error message doesn’t sounds good, I/O frozen… Your SQL Server needs its I/O, and how could frozen I/O be anything but bad?
Well it turns out that when Veeam, Veritas, Symantec Business Continuance Volume (BCV) or other third party backup tools that uses a VSS (Volume Shadow Copy Services), it temporarily freezes the I/O, then quickly resumes it. Keep in mind that Veeam for instance is a really awesome tool, that just happens to use a built in SQL Server feature to use snapshots on the backup. Veeam an other backup tools do this to get the most solid backup possible when a virtual machine is being backed up.
Some of the biggest performance tuning wins that I have had over my career have been related to performance tuning queries that are being called from SSIS. So often the actual query performance gets overlooked in the SSIS environment. A few years ago I was able to tune a query that was being called from an SSIS package and reduce the runtime of that package from over an hour, to just 2 minutes. Its not always that big of a win, and there are other performance tuning options besides just tuning the queries, so lets take a look at some of them.
 SQL Server Integration Services (SSIS) is one of those components that can help you out with your ETL (Extract, Transform and Load) work, or it can hinder your process if it is a poor performing ETL. There are many things that can easily cause an ETL to run for hours, when it should be running for minutes.
The following tips are intended as things to consider when performance tuning to improve your ETL Performance Using SSIS.
Statistics IO and Statistics Time is another SQL Server Performance Tuning Tip to help you better understand performance bottlenecks.
Have you ever wanted to know exactly how long it took for a query to run? Have you ever wondered how many I/O reads or writes were caused by your query? With Statistics IO and Statistics Time you can understand both of these.
This post is on using statistics IO to analyze query performance. There is another post on using Statistics Time for performance tuning.
I usually prefer to use Statistics IO over Statistics Time because the Statistics IO option gives better details on what exactly the query is doing.
Let’s take the following query as an example:
Statistics IO and Statistics Time are another SQL Server Performance Tuning Tip to help you better understand performance bottlenecks.
Have you ever wanted to know exactly how long it took for a query to run? Have you ever wondered how many I/O reads or writes were caused by your query? With Statistics IO and Statistics TIME you can understand both of these.
This post is on using statistics TIME to analyze query performance. There is another post on using Statistics IO for performance tuning.
Another SQL Server Performance Tuning Tip to help you better understand performance bottlenecks.
This is a simple step to get performance statistics on about any query you are writing in SSMS.
Let’s take the following query as an example:
Read More »Using Statistics Time for Performance Tuning in SSMS
When you are looking for deadlocks there are, like most things in SQL Server, more than one way to find the deadlocks. This article is specifically focused on using the SQL Server ERRORLOG file located in the LOG directory for the SQL instance. If you used the defaults on SQL Server 2012, this log would be at this location:
C:\Program Files\Microsoft SQL Server\MSSQL11.MSSQLSERVER\MSSQL\Log\ERRORLOG
For SQL Server 2014 it would be here:
C:\Program Files\Microsoft SQL Server\MSSQL12.MSSQLSERVER\MSSQL\Log\ERRORLOG
and in similar locations for other versions of SQL Server.
A deadlock is a specific case in SQL Server and other databases where, in the simple case of two transactions, the first transaction gets stuck waiting on blocking from the second transaction, and the second transaction gets stuck waiting on blocking for the first transaction.
Imagine traffic so jammed up that one lane of travel is blocking another lane of travel, and vice versa. The deadlock in SQL Server is similar to this, but instead of traffic being blocked, it is queries and transactions being blocked.
Eventually in traffic when cars are blocking, one will give up and back out, and the other will be allowed to drive through. The one that backs out is known as the deadlock victim.
When one query is chosen as the deadlock victim, it looks something like this:
Most DBAs know the usual difference between TRUNCATE and DELETE FROM, however one not so obvious difference between the two is how things are handled if the table is corrupt.
For instance, if you look at the corrupt database from the Database Corruption Challenge Week 1, you see the following
If you want to clear out the corrupt Revenue table, one way to attempt to do it is with a DELETE statement like this.
Read More »Difference Between TRUNCATE TABLE and DELETE FROM Table