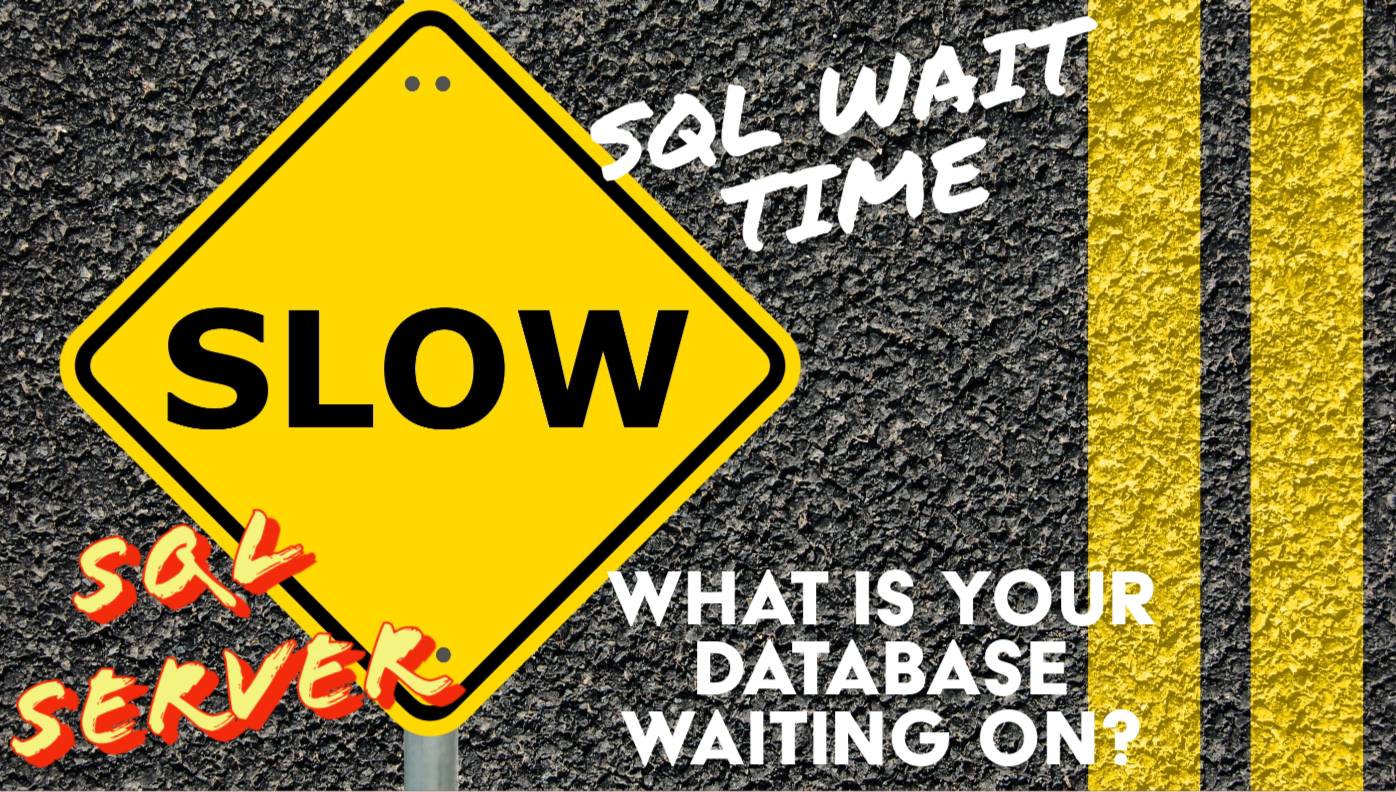
SQL Server Performance Tuning can often feel like solving a complex puzzle, and one of the most critical pieces to understand is wait types. These wait types reveal where SQL Server is spending its time, offering a window into potential bottlenecks that slow down your database operations. In this post, we’ll dive into the top 10 most common SQL Server wait types, breaking down what they mean and how they can help you diagnose and resolve performance issues.
Whether you’re dealing with sluggish query execution, high CPU usage, or I/O delays, wait types act as signposts pointing to the root cause of the problem. By identifying and interpreting these waits, you can prioritize your optimization efforts—be it tweaking server configurations, refining queries, or upgrading hardware. Our goal is to equip you with the knowledge to interpret these signals and take actionable steps toward a more efficient SQL Server environment.
From parallelism issues to disk contention and network latency, each wait type tells a unique story about your system’s health. We’ll explore waits like CXPACKET, PAGEIOLATCH, and ASYNC_NETWORK_IO, among others, to uncover their implications and suggest practical solutions. Let’s get started on this journey to better understand and improve your SQL Server Performance by dissecting these critical wait types.
Understanding the Top 10 Most Common Wait Types in SQL Server
When managing SQL Server Performance, understanding wait types is crucial for diagnosing and troubleshooting issues. Wait types provide insight into where SQL Server spends its time waiting, which often points to the underlying causes of performance bottlenecks. In this post, we’ll explore the 10 most common wait types you might encounter in SQL Server and what they typically indicate about your environment.
1. CXPACKET
The CXPACKET wait type is associated with parallel query execution. It indicates that a thread is waiting for other threads to complete their tasks in a parallel query. While CXPACKET waits are normal in parallel processing, high occurrences can sometimes point to issues with parallelism, such as uneven data distribution across threads. To address this, you might need to revisit your server’s MAXDOP (maximum degree of parallelism) settings or review the execution plans of queries causing high CXPACKET waits.
2. SOS_SCHEDULER_YIELD
This wait occurs when a SQL Server worker thread voluntarily yields the CPU, allowing other threads to execute. While some SOS_SCHEDULER_YIELD waits are expected, consistently high values may indicate CPU pressure. If your CPU is consistently under heavy load, consider optimizing your queries, indexing strategy, or even scaling up your hardware.
3. PAGEIOLATCH_SH / PAGEIOLATCH_EX
These wait types occur when SQL Server waits for pages to be read from disk into memory. PAGEIOLATCH_SH refers to a shared latch (read operation), while PAGEIOLATCH_EX refers to an exclusive latch (write operation). High PAGEIOLATCH waits often point to I/O bottlenecks, possibly due to slow storage subsystems or insufficient memory. Addressing these waits may involve upgrading your storage or increasing memory to reduce the frequency of disk reads.
4. LCK_M_X / LCK_M_S
Lock waits, particularly LCK_M_X (exclusive locks) and LCK_M_S (shared locks), are common in environments with high contention. These waits indicate that queries are waiting for locks on resources, leading to potential blocking issues. To mitigate high lock waits, review your transaction isolation levels, optimize your queries to lock fewer rows, or consider implementing a row-versioning-based isolation level like Snapshot Isolation.
5. ASYNC_NETWORK_IO
ASYNC_NETWORK_IO waits occur when SQL Server is waiting for the client to acknowledge that it has received data. This wait type can indicate slow client processing, network latency, or excessive data being sent to the client. If you see high ASYNC_NETWORK_IO waits, investigate network performance, or consider optimizing queries to return smaller result sets.
6. WRITELOG
This wait type is encountered when SQL Server is waiting for transaction log writes to complete. High WRITELOG waits often point to performance issues with the disk subsystem that hosts the transaction log files. To reduce WRITELOG waits, ensure your transaction log is on fast storage, like SSDs, and consider separating it from data files to avoid contention.
7. PAGEIOLATCH_UP
PAGEIOLATCH_UP is similar to PAGEIOLATCH_SH but occurs during update operations when SQL Server waits for a page to be read from disk into memory for modification. Frequent PAGEIOLATCH_UP waits suggest disk I/O bottlenecks. As with PAGEIOLATCH_SH, upgrading your storage or adding more memory to cache data pages can help alleviate these waits.
8. HADR_SYNC_COMMIT
In Always On Availability Groups, HADR_SYNC_COMMIT waits occur when a transaction is waiting for a synchronous replica to acknowledge that it has hardened the log. High HADR_SYNC_COMMIT waits can indicate network latency or performance issues on the secondary replica. To mitigate these waits, ensure low-latency, high-throughput network connections between your replicas and optimize the performance of your secondary nodes.
9. RESOURCE_SEMAPHORE
RESOURCE_SEMAPHORE waits happen when queries are waiting for memory to be available for execution. This wait type typically indicates memory pressure, especially for large queries requiring significant memory grants. Addressing RESOURCE_SEMAPHORE waits might involve adding more memory, optimizing large queries, or adjusting your server’s memory grant settings.
10. LOGBUFFER
LOGBUFFER waits occur when SQL Server is waiting for space in the log buffer to write new log records. These waits are often related to transaction log performance issues. If you encounter high LOGBUFFER waits, review your log buffer settings, and ensure your transaction log files are on high-performance storage.
Conclusion
Understanding and analyzing these common wait types can provide invaluable insights into SQL Server’s Performance issues. By monitoring these waits, you can identify the root causes of performance bottlenecks and take the necessary steps to optimize your environment. Whether it’s adjusting parallelism settings, optimizing disk I/O, or improving network performance, addressing these common wait types can lead to significant improvements in your SQL Server’s responsiveness and overall efficiency.
Recommendation: For ongoing wait stat monitoring, consider using Database Health Monitor. It’s a comprehensive tool designed to help DBAs monitor SQL Server performance, including wait statistics, and offers actionable insights to keep your environment running smoothly.

If you’re facing persistent wait types in your environment and need expert advice, consider reaching out for a comprehensive performance assessment tailored to your SQL Server setup.
Summary for SQL Server Wait Types
- SQL Server wait types are key indicators of performance bottlenecks, revealing where the system spends time waiting.
- CXPACKET waits relate to parallel query execution, often requiring adjustments to MAXDOP settings.
- PAGEIOLATCH waits (SH, EX, UP) indicate I/O bottlenecks, suggesting a need for better storage or more memory.
- Lock waits (LCK_M_X, LCK_M_S) highlight contention issues, which can be mitigated by optimizing transactions.
- ASYNC_NETWORK_IO waits point to network latency or slow client processing, necessitating query or network optimization.
- WRITELOG and LOGBUFFER waits suggest transaction log performance issues, often resolved with faster storage.
- RESOURCE_SEMAPHORE waits indicate memory pressure, potentially requiring more memory or query adjustments.
More from Stedman Solutions:

Steve and the team at Stedman Solutions are here for all your SQL Server needs.
Contact us today for your free 30 minute consultation..
We are ready to help!