
You usually don’t notice a slow query right away. What you do notice is everything else starting to lag. Dashboards take longer to load, jobs start overlapping, and suddenly users are asking what changed.
Long running queries are often at the center of that.
The good news is they’re not hard to track down when you have the right visibility. In this post, we’ll walk through how to quickly spot them, understand their impact, and decide what to do next using Database Health Monitor.
Start With a Simple Question: Where Is Time Being Spent?
When performance dips, one of the fastest ways to get your bearings is to look at query duration over time. Not just a single slow query, but patterns.
That’s where the Long Running by Hour report at the instance level comes in.
Long Running by Hour Report at the Instance Level
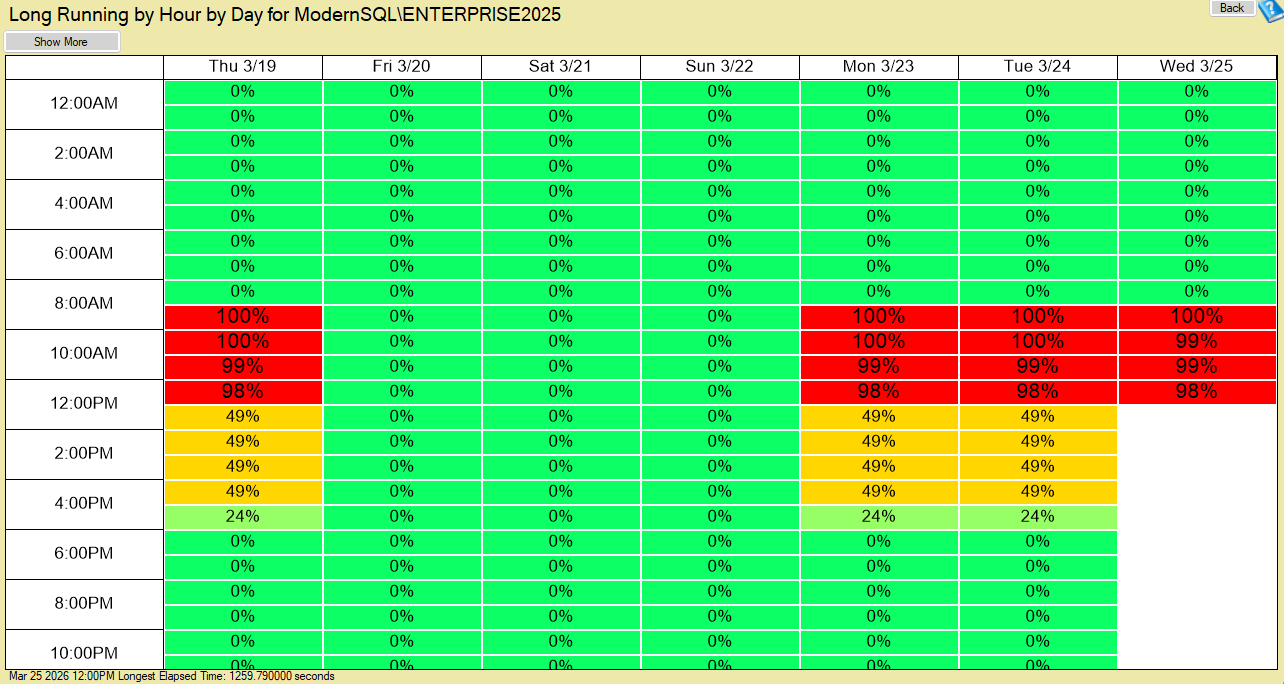
This report gives you a heatmap view of long running queries across the entire instance, broken down by hour.
Instead of digging through individual queries right away, you can immediately answer questions like:
- Are slow queries happening consistently or only at certain times?
- Is there a spike during business hours or overnight jobs?
- Did something change recently?
If you see a cluster of activity in a specific time window, that’s your starting point. From there, you can drill deeper.
Dig Into the Queries Themselves
Once you’ve identified when the problem is happening, the next step is figuring out what is actually running.
Long Running History Report at the Instance Level
The Long Running History report at the instance level shows you the longest running queries captured over time across the entire server.
This is where things get actionable.
Instead of guessing, you can see:
- Which queries are consistently taking the longest
- How long they actually ran
- When they occurred
- Which database they were running in
And if you look a little closer, you can also identify where they came from. The report includes details like the login, host machine, and application name, which makes it much easier to trace the source.
This is especially helpful when the issue isn’t obvious. For example, you might find that a scheduled job, reporting tool, or application process is responsible for the majority of your long running workload.
Narrow It Down to a Specific Database
Sometimes the problem isn’t instance-wide. It’s isolated to a single database.
Long Running History Report at the Database Level
The Long Running History report at the database level gives you the same level of detail, but scoped to one database at a time.
This is useful when:
- One application is experiencing performance issues
- You’re troubleshooting a specific database complaint
- You want to isolate tuning efforts without noise from other workloads
You still get the same rich details, including duration, reads, writes, wait types, and the query text itself. That makes it much easier to focus your optimization efforts where they matter most.
What to Look For in These Reports
As you review long running queries, a few patterns tend to stand out:
- Queries that show up repeatedly over time
- Sudden spikes in duration for queries that are normally fast
- High read or write activity compared to similar queries
- Wait types that point to underlying issues like I/O or locking
You don’t need to analyze everything at once. Start with the worst offenders and work your way down.
Connecting the Dots With Other Performance Data
Long running queries rarely exist in isolation. They often create ripple effects across your server.
If you see a query running for a long time, it’s worth checking:
- Blocking activity to see if it’s holding up other sessions
- Wait statistics to understand what the query is waiting on
- Execution plans to identify inefficient operations
When you combine these views, you move from “this query is slow” to “this is why it’s slow.”
Turning Insight Into Action
Once you’ve identified a problematic query, the next step is deciding how to improve it.
Common fixes include:
- Adding or adjusting indexes
- Updating query logic to reduce unnecessary work
- Breaking large operations into smaller batches
- Addressing blocking or contention issues
- Reviewing application behavior if queries are being triggered inefficiently
Not every long running query is a problem, but the ones that consistently consume resources or block other work are worth addressing.
Why This Matters
Ignoring long running queries doesn’t just affect a single process. Over time, they can:
- Consume CPU, memory, and I/O resources
- Increase blocking and wait times
- Cause jobs to run longer than expected
- Impact application responsiveness
Catching them early and understanding their behavior makes a huge difference in overall system stability.
Final Thoughts
Tracking down long running queries used to mean digging through logs or catching them in real time. With the right reports, you can quickly see both the big picture and the details that matter.
Start with the hourly view to spot patterns. Use the history reports to identify the worst offenders. Then focus your tuning efforts where they’ll have the biggest impact.
If you’d like help reviewing long running queries or improving SQL Server Performance, you can always reach out to Stedman Solutions for guidance.
More from Stedman Solutions:

Steve and the team at Stedman Solutions are here for all your SQL Server needs.
Contact us today for your free 30 minute consultation..
We are ready to help!