We hope you enjoyed our 10 days of Database Health Monitor Reports. We enjoy making your job easier!
To it even easier we’ve created this blog post with all 10 days listed.
Don’t have Database Health Monitor? Learn more about it.
- The databases by size report is a quick and easy way to see which databases on your SQL Server are the largest.
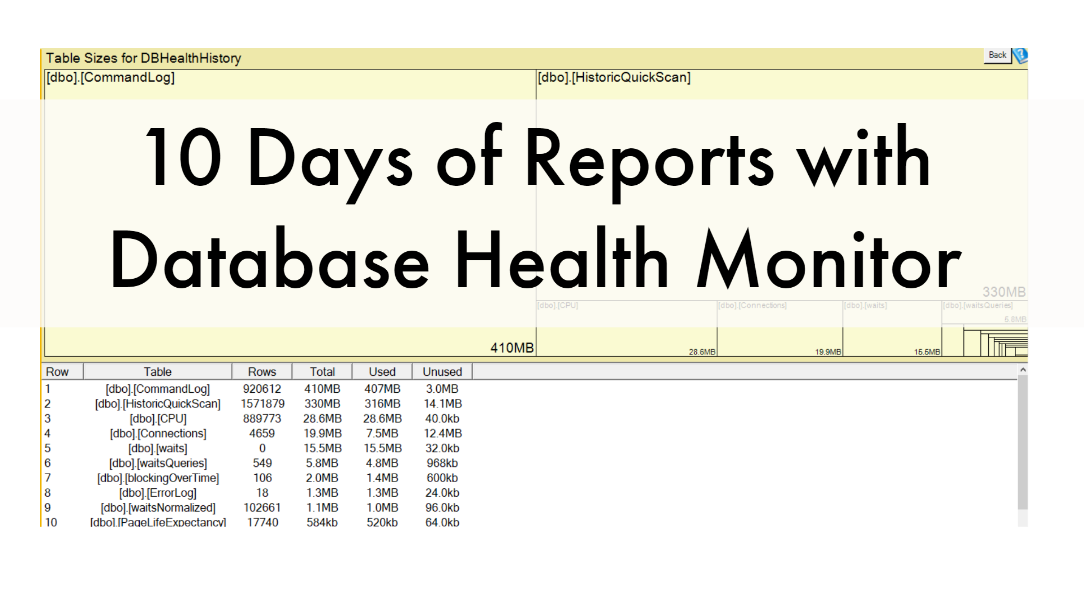
- The Table Size report shows you the tables that are using the most disk space in your database.
- This report is commonly used to check in on the status of data files and log files for SQL Server.
- The SQL CPU by Hour of Day report lets you see what the average CPU load was per hour for the last week and beyond.
Day 5 – Blocking by Hour of Day
- This chart is used to find the hours of the day that blocking occurs the most.
Day 6 – Inventory All Instances
- This report is a great way to pull a list of all your SQL Server and save it to an spreadsheet for auditing or licensing purposes.
Day 7 – Waits by Type for Instance
- The waits by type for instance page shows you the most commonly occurring waits on your SQL Server.
- The I/O by database page shows the databases with the most IO on your system.
- The I/0 By drive report gives you an overview of how much I/O each drive holding database or log files is using.
Day 10 – Server Overview
- With the server overview page you can keep close tabs on some of the key performance indicators for a SQL Server.
Learn more reports like these and more in our Online Course:
“Using Database Health Monitor”
More from Stedman Solutions:

Steve and the team at Stedman Solutions are here for all your SQL Server needs.
Contact us today for your free 30 minute consultation..
We are ready to help!


