Today I released the August 2019 release of Database Health Monitor. This is version 2.9.
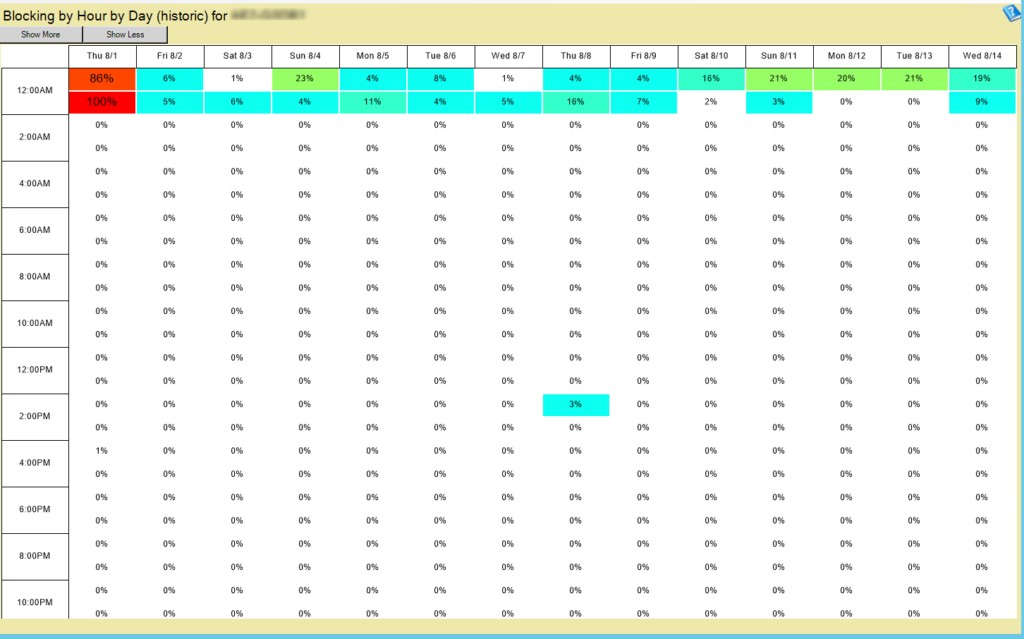
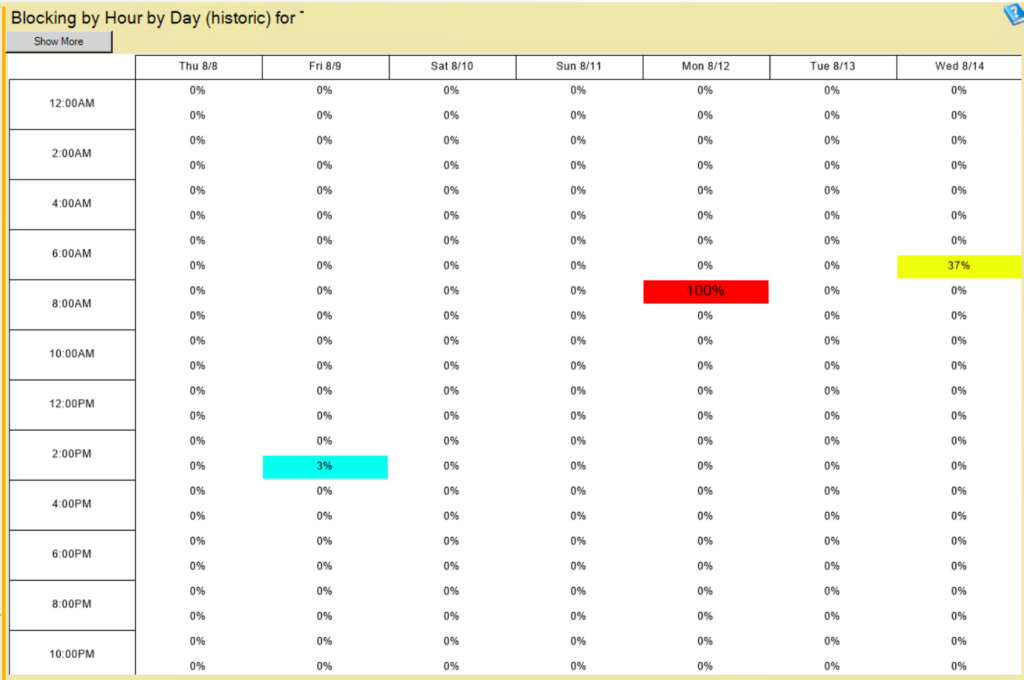
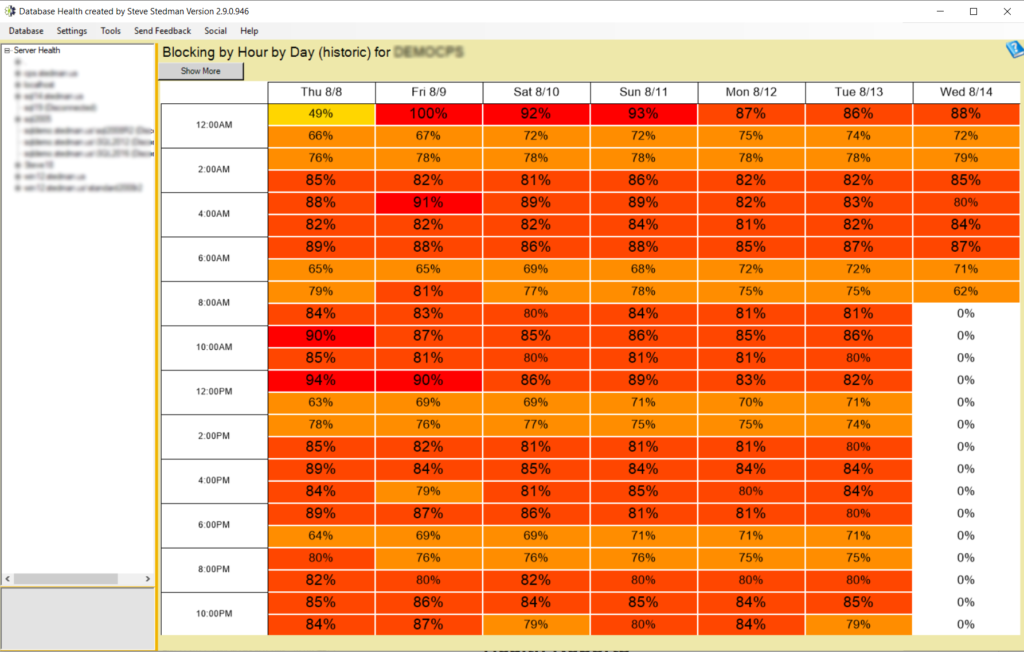
My favorite new report is the Blocking By Hour of Day report which uses the existing data that is collected by the historic monitoring feature.
Below is a list of some of the things that have been fixed or added in this version and the last version.
Version 2.9 Release Notes
Version 2.9 is the August 2019 release of Database Health Monitor. Summer has been busy, I have added one new report and I have been working on fixing any customer reported bugs.
New Features in 2.9
- Added a new Blocking Heat Map report that shows by day and by hour when blocking is occurring.
Bug Fixes in 2.9
- Fixed bug with extra buttons on the all servers reports “System Overview” and “Dashboard” show the same thing. I removed system overview.
- Fixed bug when clicking on FAILED JOBS and there are no failed jobs, the presentation is a little weird with overlapping controls.
- Fixed a customer reported bug in the Missing Indexes advisor where when adding indexes with both inequality and equality columns there was a missing comma in the index creation script.
- Fixed bug with clicking on CPU LOAD BY HOUR I can click SHOW MORE until the button disappears. However, there’s more data. If I click CTRL PAGEDOWN to go to the next instance and CTRL PAGEUP to go back to the original instance the SHOW MORE button is there
- Fixed a bug with the Blocking Query Monitor where it was attempting to connect to the DBHealthHistory database and sometimes throwing an error. Changed the connection to master since the DBHealthHistory database is not needed for this feature.
Version 2.8.2 Release Notes
Version 2.8.2 is the July 2019 Release of Database Health Monitor. There was a 2.8 release on July 17, 2019, followed shortly by a 2.8.2 release after a report of a bug in the blocking queries report that was fixed.
New Features in 2.8.2
- Added threshold settings into the Application Settings dialog to control the red/yellow/green colors on the backup reports and the CheckDB reports. This was a customer request.
- Expanded the Fragmented Indexes report to show up to 10,000 fragmented indexes from the original limit of 100. This was a customer reported issue.
- Added a new check to the QuickScan report for SQL Server 2008 and SQL Server 2008R2 approaching end of life in July.
- Added a check to see if the same instance is configured twice in the historic monitoring. If it is then it fixes it so that it is only being monitored once.
- Added a notes column to the backup status report to show if the last full was copy only.
- Column added to the backup status report to show if the database is online, offline, single user, emergency, or restricted user mode (customer requested).
- Column added to the database by size instance report to show if the database is online, offline, single user, emergency, or restricted user mode (customer requested).
Bug Fixes in 2.8.2
- Fixed a bug that slowed connecting to each server overview panel.
- Fixed a bug in the blocking queries report where it was failing on case sensitive databases. Reported by a customer.
- There was an issue with the historic waits not displaying the correct list of waiting queries in the lower grid, when the time range was an hour or less. This has been corrected.
- Fixed an issue with the chart on the historic waits advisor sizing, where it was not showing the chart data.
- Fixed a bug that was crashing when attempting to view reports on a database that was no longer connected. This was a customer reported issue.
- The Databases by Size report had a limit of 25 imposed on it. Based on customer feedback, I remove this limit. The pie chart still has the limit, but the grid now displays them all.
- Fixing a few bugs around users running with the limited permission of serveradmin rather than sysadmin. The Quickscan report was failing, and so was the main instance overview page. These issues have been fixed.
- Fixed a bug with where full databases (copy_only) backups were being missed in the backup report.
You can download Database Health Monitor and use it to day for free.
More from Stedman Solutions:

Steve and the team at Stedman Solutions are here for all your SQL Server needs.
Contact us today for your free 30 minute consultation..
We are ready to help!