Yesterday I released the first update to Database Health Monitor in a couple of months. There were some new features and some fixed saved up that were released yesterday.
I did however run into 2 small bugs that were quickly dealt with in version 2.8.0 and 2.8.1. With some quick bug reporting for a couple of super users, and some debugging on my part I was able to get the issues fixed.
So what is new with this 2.8.x update?
Version 2.8.2 Release Notes
Version 2.8.2 is the July 2019 Release of Database Health Monitor. There was a 2.8 release on July 17, 2019, followed shortly by a 2.8.1 and 2.8.2 release after a report of a bug in the blocking queries report that was fixed.
New Features in 2.8.2
- Added threshold settings into the Application Settings dialog to control the red/yellow/green colors on the backup reports and the CheckDB reports. This was a customer request.
- Expanded the Fragmented Indexes report to show up to 10,000 fragmented indexes from the original limit of 100. This was a customer reported issue.
- Added a new check to the QuickScan report for SQL Server 2008 and SQL Server 2008R2 approaching end of life in July.
- Added a check to see if the same instance is configured twice in the historic monitoring. If it is then it fixes it so that it is only being monitored once.
- Added a notes column to the backup status report to show if the last full was copy only.
- Column added to the backup status report to show if the database is online, offline, single user, emergency, or restricted user mode (customer requested).
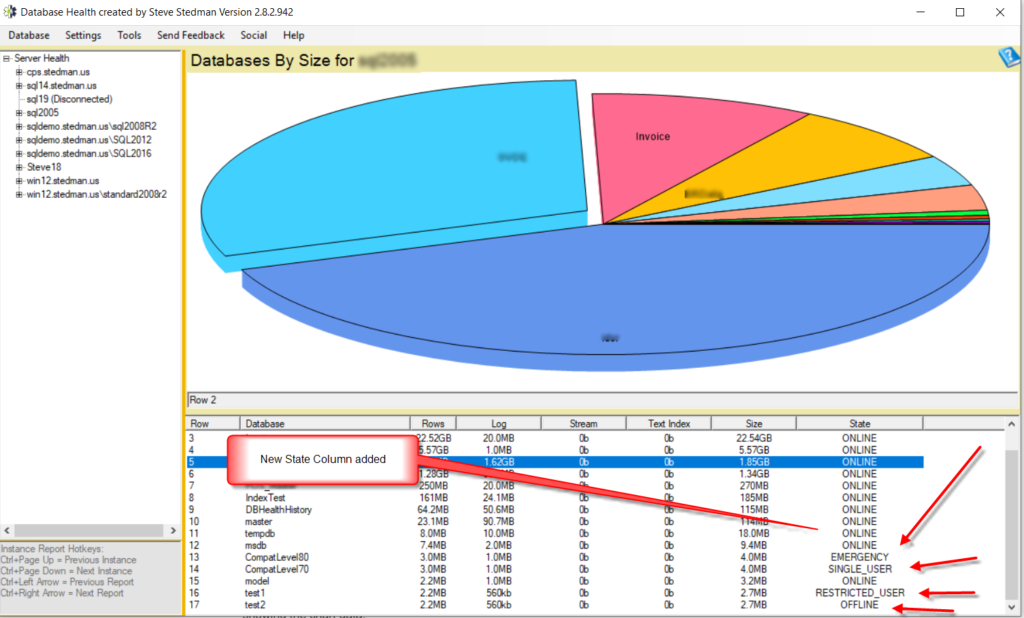
- Column added to the database by size instance report to show if the database is online, offline, single user, emergency, or restricted user mode (customer requested).
Bug Fixes in 2.8.2
- Fixed a bug that slowed connecting to each server overview panel.
- Fixed a bug in the blocking queries report where it was failing on case sensitive databases. Reported by a customer.
- There was an issue with the historic waits not displaying the correct list of waiting queries in the lower grid, when the time range was an hour or less. This has been corrected.
- Fixed an issue with the chart on the historic waits advisor sizing, where it was not showing the chart data.
- Fixed a bug that was crashing when attempting to view reports on a database that was no longer connected. This was a customer reported issue.
- The Databases by Size report had a limit of 25 imposed on it. Based on customer feedback, I remove this limit. The pie chart still has the limit, but the grid now displays them all.
- Fixing a few bugs around users running with the limited permission of serveradmin rather than sysadmin. The Quickscan report was failing, and so was the main instance overview page. These issues have been fixed.
- Fixed a bug with where full databases (copy_only) backups were being missed in the backup report.
New Developer on Database Health Monitor
The latest release of Database Health Monitor is the first release that my son George has contributed to the code. He was responsible for a couple of the new features added this time around. George works with me at Stedman Solutions doing custom applications for clients, and I expect that we will see more contributions from him in Database Health Monitor in the future.
Download the latest version if you haven’t done so already and take a look.
Related Links
More from Stedman Solutions:

Steve and the team at Stedman Solutions are here for all your SQL Server needs.
Contact us today for your free 30 minute consultation..
We are ready to help!