Statistics IO and Statistics Time is another SQL Server Performance Tuning Tip to help you better understand performance bottlenecks.
Have you ever wanted to know exactly how long it took for a query to run? Have you ever wondered how many I/O reads or writes were caused by your query? With Statistics IO and Statistics Time you can understand both of these.
Statistics IO for Performance Analysis
This post is on using statistics IO to analyze query performance. There is another post on using Statistics Time for performance tuning.
I usually prefer to use Statistics IO over Statistics Time because the Statistics IO option gives better details on what exactly the query is doing.
Let’s take the following query as an example:
SELECT *
FROM Orders AS o
	 INNER JOIN
	 Customers AS c
	 ON c.id = o.customerId
WHERE c.LastName = 'HOBBS';
This query is using the database from Database Corruption Challenge #10.
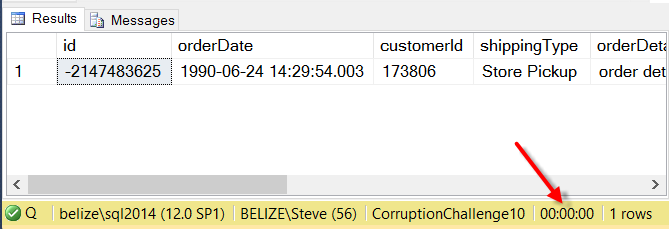
When we run the query it runs pretty quick and as you can see in the following output, it shows the elapsed time was 00:00:00. However you are given no clues as to how much I/O occurred.
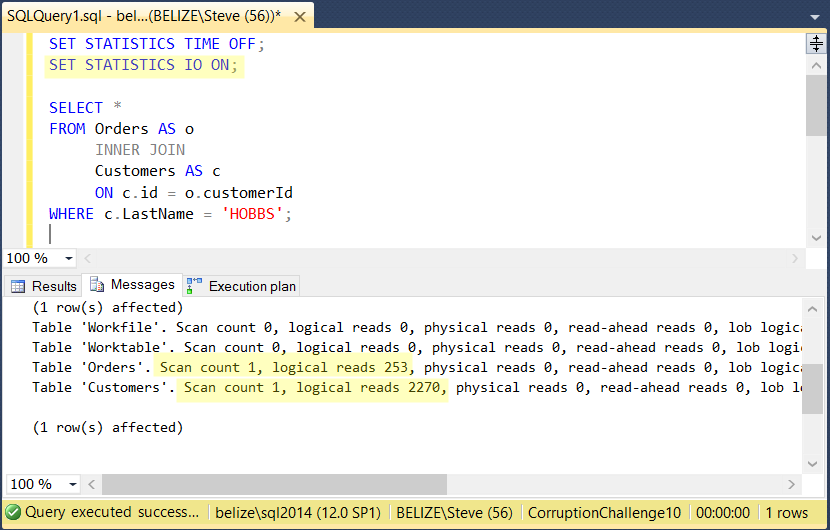
Introducing the Statistics IO command. Notice first I turned Statistics Time off, since it had already been enabled in my previous query. When you turn Statistics IO or Statistics Time on, it remains on for the current session in SSMS until you turn it off again. You can turn it on an off throughout your batch to test specific queries.
SET STATISTICS TIME OFF;
SET STATISTICS IO ON;

SELECT *
FROM Orders AS o
	 INNER JOIN
	 Customers AS c
	 ON c.id = o.customerId
WHERE c.LastName = 'HOBBS';
With the Statistics IO output you can see that the query caused one scan on Orders and one scan on the customers table. More importantly you can see that it caused 253 reads on Orders and 2270 reads on Customers. A read is the access of an 8K chunk of memory in SQL Server. The good news here is that there were no physical reads. The physical reads means that the query had to read from disk, where a logical read didn’t need to hit the disk, it just read a page that was already in memory.
Where it gets ugly is when you have a query that has high numbers of scans and super high number of reads. Small numbers like we are seeing here aren’t too bad, however adding the right index could significantly reduce the number or reads.
Comparing queries with Statistics IO
Now lets take a look at the difference in IO between two similar queries with statistics IO enabled.
SET STATISTICS IO ON;

SELECT *
FROM Orders AS o
	 INNER JOIN Customers AS c ON c.id = o.customerId
WHERE c.LastName = 'HOBBS';

SELECT *
FROM Orders AS o
	 INNER JOIN Customers AS c ON c.id = o.customerId
WHERE c.LastName like 'HOBBS';
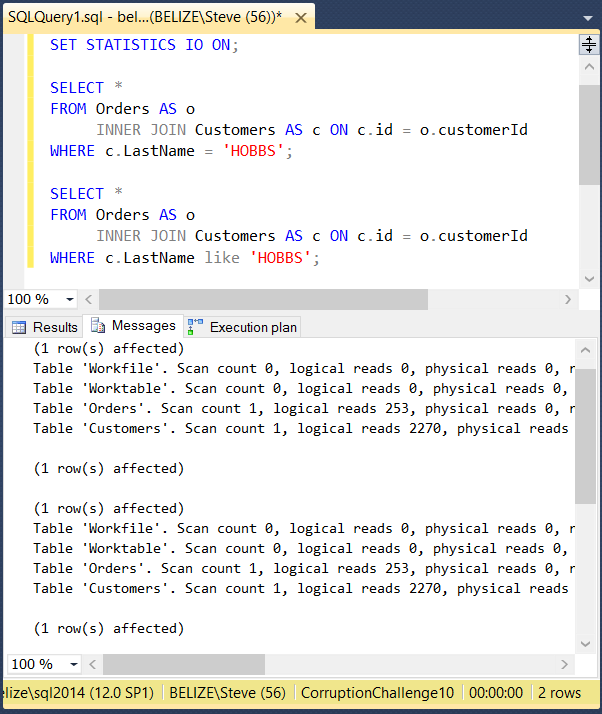
The only difference between the two queries is the LIKE vs the equal comparison.
You can see in this case the I/O is exactly the same between the two queries.
Adding An Index To Reduce IO
This could be a topic for an entire series on performance tuning, but lets take a quick look at what happens when we add an index.
CREATE NONCLUSTERED INDEX idxTestIO
ON [dbo].[Customers] ([LastName])
INCLUDE ([id],[FirstName],[MiddleName]);
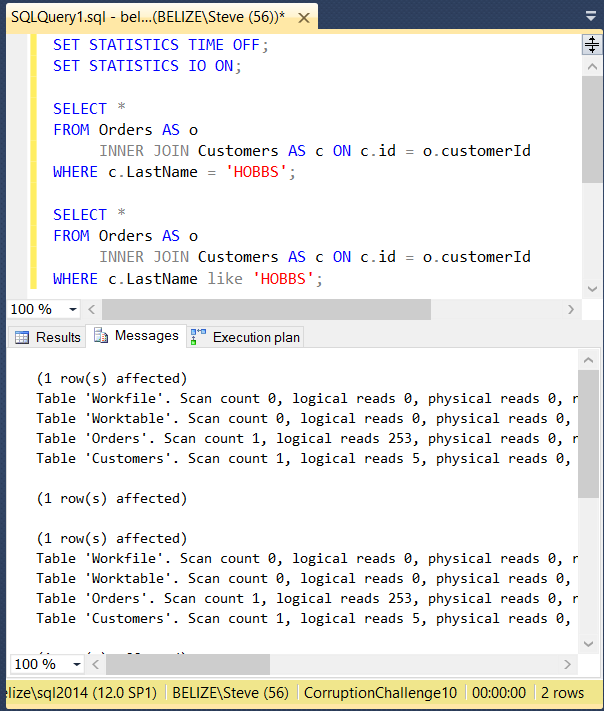
When we run the two queries again, you can see that they perform the same, but the IO numbers are much smaller than prior to adding the index. Here we see 5 logical reads on customers rather than 2270 before.
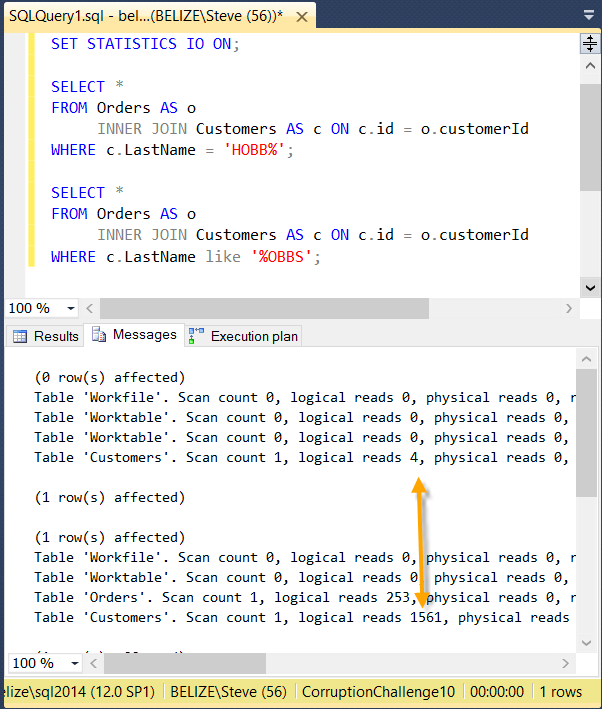
You have probably heard that adding a wildcard to the front of a search string in a LIKE comparison is slower than a wildcard at the end. Lets take a look at how that compares using the index and some wild card comparisons.
SET STATISTICS IO ON;

SELECT *
FROM Orders AS o
	 INNER JOIN Customers AS c ON c.id = o.customerId
WHERE c.LastName = 'HOBB%';

SELECT *
FROM Orders AS o
	 INNER JOIN Customers AS c ON c.id = o.customerId
WHERE c.LastName like '%OBBS';
Here you can see that the wildcard on the end of the LIKE comparison requires 4 logical reads, but the wildcard at the beginning uses 1561 logical reads. On larger tables that difference can be even wider.
I hope at this point you have a better understanding of how to use the Statistics IO command in SSMS to help troubleshoot performance issues on Microsoft SQL Server. This post applies to SQL Server 2005, 2008, 2008R2, 2012, 2014 and 2016.
Need Help?
Need help with SQL Server Performance tuning or to just better understand query performance Stedman Solutions can help.
Part of the services offered by Stedman Solutions, LLC focus on SQL Server performance tuning. We can help track down and diagnose your SQL Server performance problems. Contact us today for a free 30 minute consultation.
Related Links
- Statistics Time for performance tuning
- Database Health Monitor Download
- Stedman Solutions, LLC
- Performance Tuning on SteveStedman.com
More from Stedman Solutions:

Steve and the team at Stedman Solutions are here for all your SQL Server needs.
Contact us today for your free 30 minute consultation..
We are ready to help!
