Being day 27 of the DBCC Command month at SteveStedman.com, today’s featured DBCC Command is DBCC SQLPERF.
Description:
DBCC SQLPERF is used to do a couple different things.
- Show a list of all the wait stats on your SQL Server.
- Show a list of the transaction log and the space used in the transaction log.
- Clear the wait stats.
- Clear the latch stats.
DBCC SQLPERF Syntax:
dbcc sqlperf
( option ) [ WITH NO_INFOMSGS ]
Where option can be any of the following:
- WAITSTATS
- LOGSPACE
- ‘sys.dm_os_latch_stats’ , CLEAR
- ‘sys.dm_os_wait_stats’ , CLEAR
Example of Viewing Wait Statistics:
The following example shows the list of wait statistics on your SQL Server since the instance was last restarted, or the stats were last cleared.
DBCC SqlPerf(waitstats);
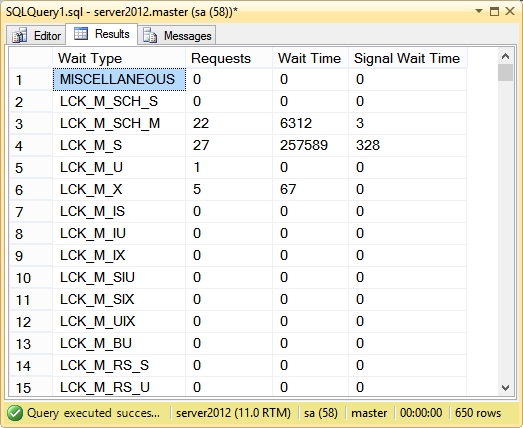
The results include 650 rows of wait statistics, many of which are 0.
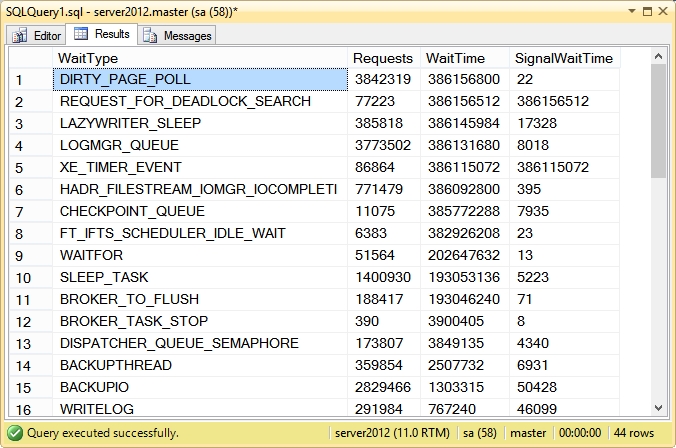
A better way to format this would be to dump the results into a table variable, then you can run operations like sorting on the result set, or filtering out the 0 values.
declare @WaitStats table
(
WaitType varchar(255),
Requests int,
WaitTime bigint,
SignalWaitTime bigint
);

insert into @WaitStats
execute('dbcc sqlperf(waitstats)');

select *
from @WaitStats
 WHERE WaitType != 'Total'
AND Requests != 0
AND WaitTime != 0
AND SignalWaitTime != 0
 ORDER by WaitTime Desc;
If you are interested in Wait Stats, another way to track Wait Stats over time is with the Database Health Reports application which includes real time reporting as well as historic (over time) wait stat reporting. With the Database Health Reports application you can even track down the query that is causing the most wait stats.
Example of Clearing Wait Statistics:
The following example will clear the wait stat counters on your SQL Server.
DBCC SqlPerf('sys.dm_os_wait_stats', CLEAR);
Example of Clearing Latch Statistics:
The following example clears all the latch statistics on your SQL Server.
DBCC SqlPerf('sys.dm_os_latch_stats', CLEAR);
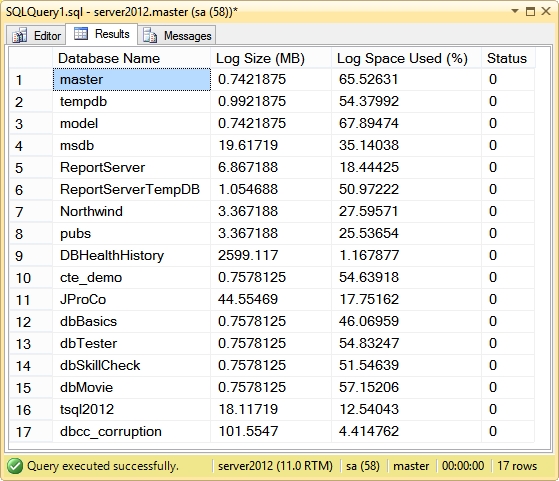
Example of Viewing Transaction Log Utilization:
The following example lists the raw output from DBCC SqlPerf (logspace), which show the overall usage of the log files for your database.
DBCC SqlPerf(logspace) ;
If we wanted to clean up the output, we could do something similar to the waitstats above by inserting the results into a table variable, and doing some sorting or filtering. How you sort or filter may be determined by where you are having trouble. For instance if you were running low on disk space, you could sort on LogSize MB.
declare @LogSpace table
(
 DB varchar(255),
 LogSizeMB int,
 PercentUsed float,
 Status int
);

insert into @LogSpace
execute('DBCC SqlPerf(logspace)');

SELECT *
 FROM @LogSpace
 ORDER By LogSizeMB desc;
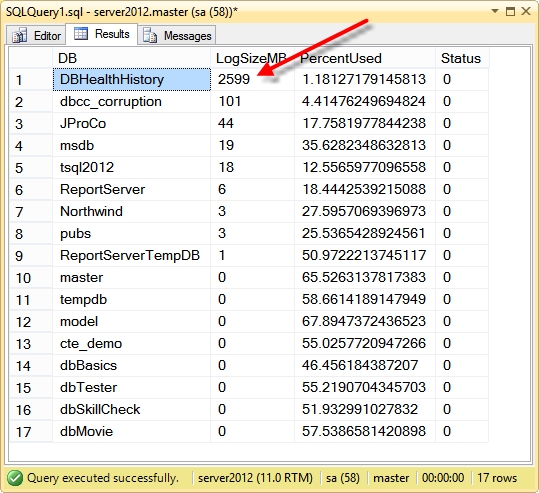
Here we can see that one log file is about two and a half GB, and significantly larger than any other database log file. This one was caused by some load testing that I was doing on the Database Health Reports application. The interesting thing here is that on 1.18% of the log file is being used, so most of that two and a half GB is being wasted.
Posts related to unusually large log files:
- Unusually large log file at the Database Health Reports website.
- Blog: Steps to shrink an unusually large log file at SteveStedman.com.
Notes:
For more information see TSQL Wiki DBCC sqlperf.
DBCC Command month at SteveStedman.com is almost as much fun as cleaning up someone a mess left in the database by someone else.
More from Stedman Solutions:

Steve and the team at Stedman Solutions are here for all your SQL Server needs.
Contact us today for your free 30 minute consultation..
We are ready to help!