With the recent release of Database Health Monitor Version 2.0 I have decided to focus on of blogging about the features and benefits of the Database Health Monitor application. There are some incredibly valuable features that are often overlooked. The purpose of this blog series is to present some of the features of the product.
If you haven’t tried Database Health Monitor, you can download it at http://DatabaseHealth.com/download. It is completely free.
Historic Waits
The Historic Waits section of Database Health monitor is in my opinion the single most valuable part of the entire product. Other vendors sell products similar the Historic Waits feature for $1500 to $2000 per SQL Server instance, making it cost prohibitive for many.
The way that Historic Waits works is that it installs a small monitoring database on a SQL Server, that can be the same SQL Server you are monitoring, or it can be a separate SQL Server just to keep track of performance.
Over time data is collected in this monitoring database that allows you to then step back in time to see what was happening with the SQL Server at a specific point in time. For instance, if you have Historic Monitoring enabled, if someone comes to you and says “The SQL Server was slow and having problems at 2:00am yesterday”, you have the ability to track down what was happening at that point in time.
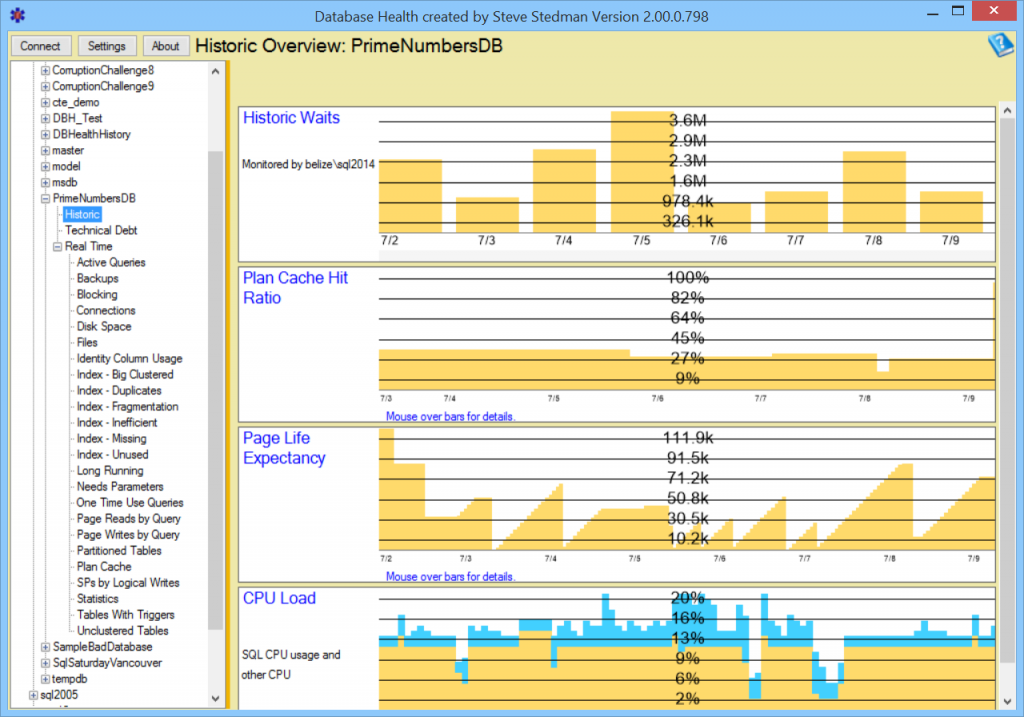
The main Historic overview page shows Waits, Plan Cache Hit Ratio, Page Life Expectancy and CPU Load over time.

Read More »Database Health Monitor – Historic Waits


