
What’s Coming in July?
We hope you enjoyed last month’s Common Table Expressions theme and all the video tips and blog posts we released. July we will be focusing… Read More »What’s Coming in July?
We hope you enjoyed last month’s Common Table Expressions theme and all the video tips and blog posts we released. July we will be focusing… Read More »What’s Coming in July?
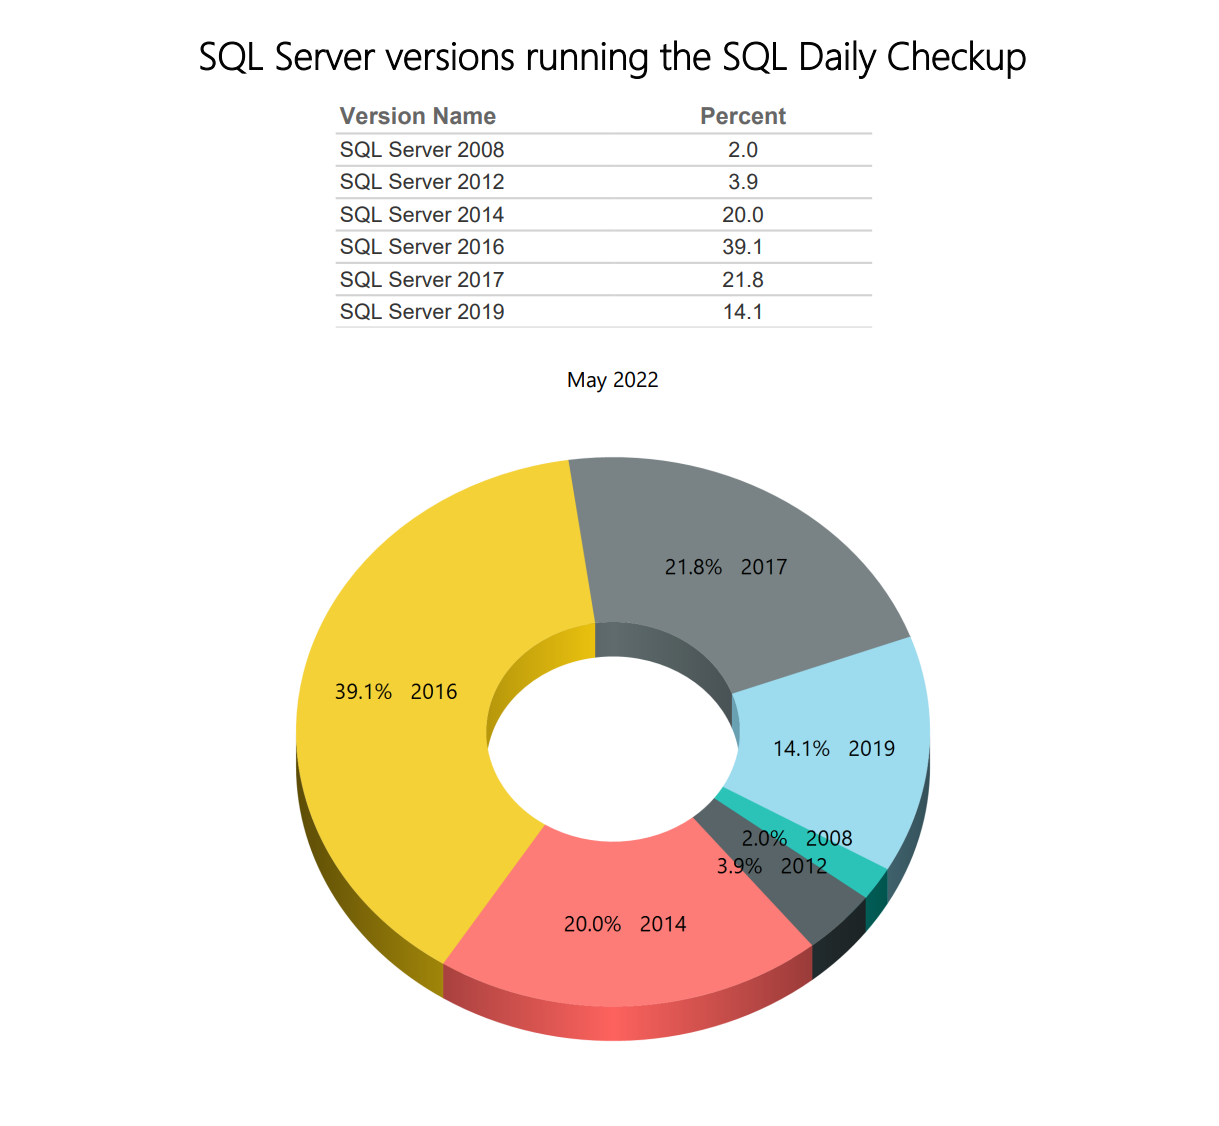
Here listed is the current percentages of SQL server versions running our Daily SQL monitoring service with Database Health Monitor. Compare this month’s percentages to Last Month’s… Read More »Daily SQL Monitoring – SQL Server Versions for May

Whenever you hear a company with over 30 years of experience tell you facts from real life scenarios, you should hear what they have to… Read More »3 Common Database Mistakes Business Owners Make

CXCONSUMER and CXPACKET are associated with parallelism. When a query that has a cost beyond the cost threshold for parallelism then that query will be… Read More »CXCONSUMER and CXPACKET Waits.

The goal at Stedman Solutions, is to create raving fans out of each client. “Just satisfied” is not enough for us. This raving fans page is… Read More »Raving Fan of March 2022 – “Best tool out there”
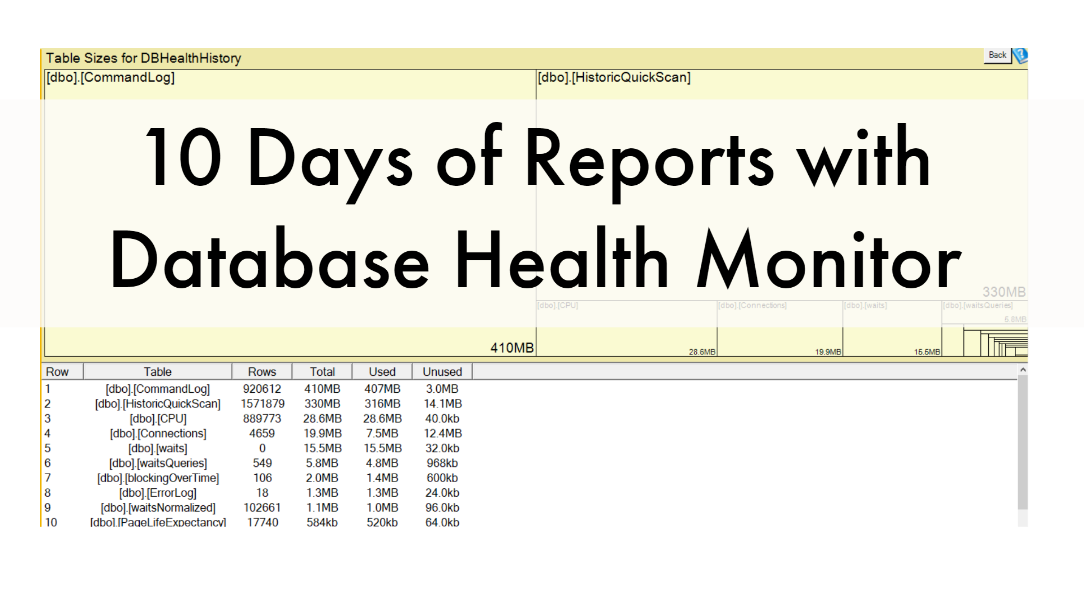
We hope you enjoyed our 10 days of Database Health Monitor Reports. We enjoy making your job easier! To it even easier we’ve created this… Read More »10 Day of Database Health Reports Recap
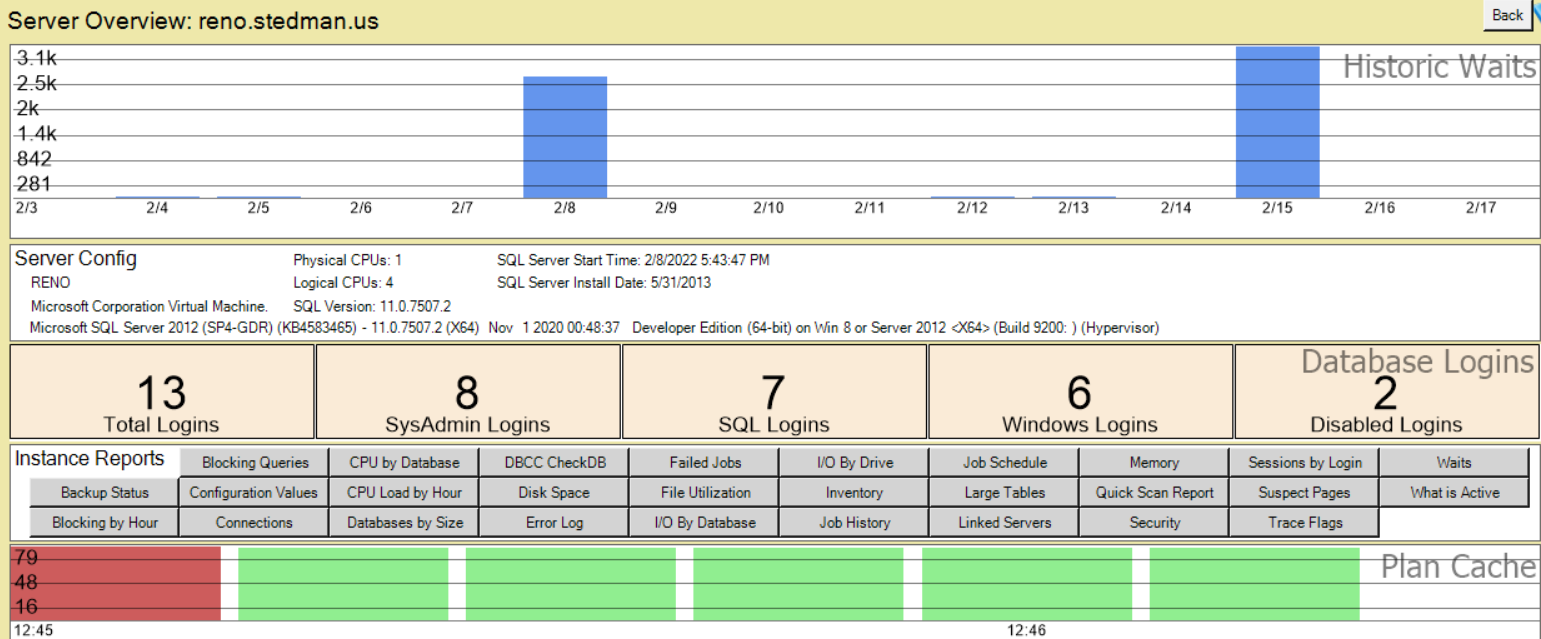
With the server overview page you can keep close tabs on some of the key performance indicators for a SQL Server. The details on this… Read More »Day 10 – Server Overview
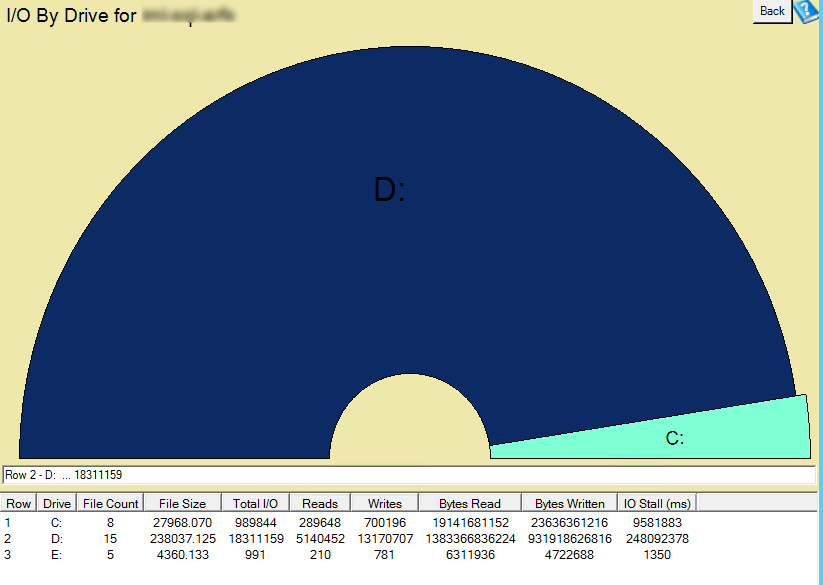
The I/0 By drive report gives you an overview of how much I/O each drive holding database or log files is using. Here is an… Read More »Day 9 – I/O By Drive
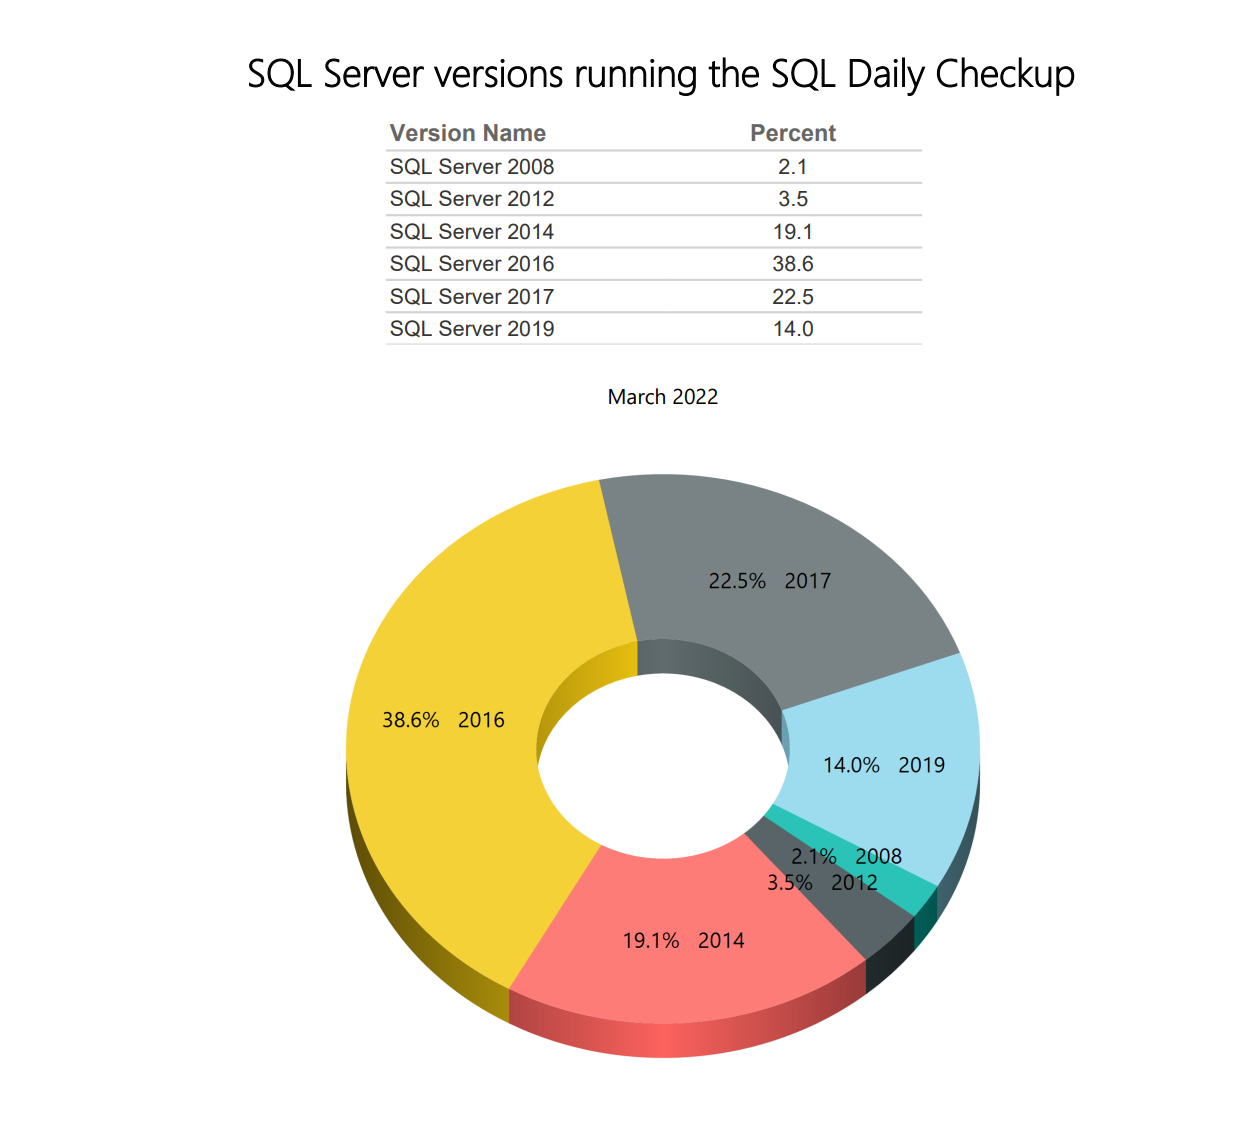
Here listed is the current percentages of SQL server versions running our Daily Check up with Database Health Monitor. Compare this month’s percentages to Last Month’s Percentages… Read More »SQL Daily Monitoring – SQL Server Versions for March
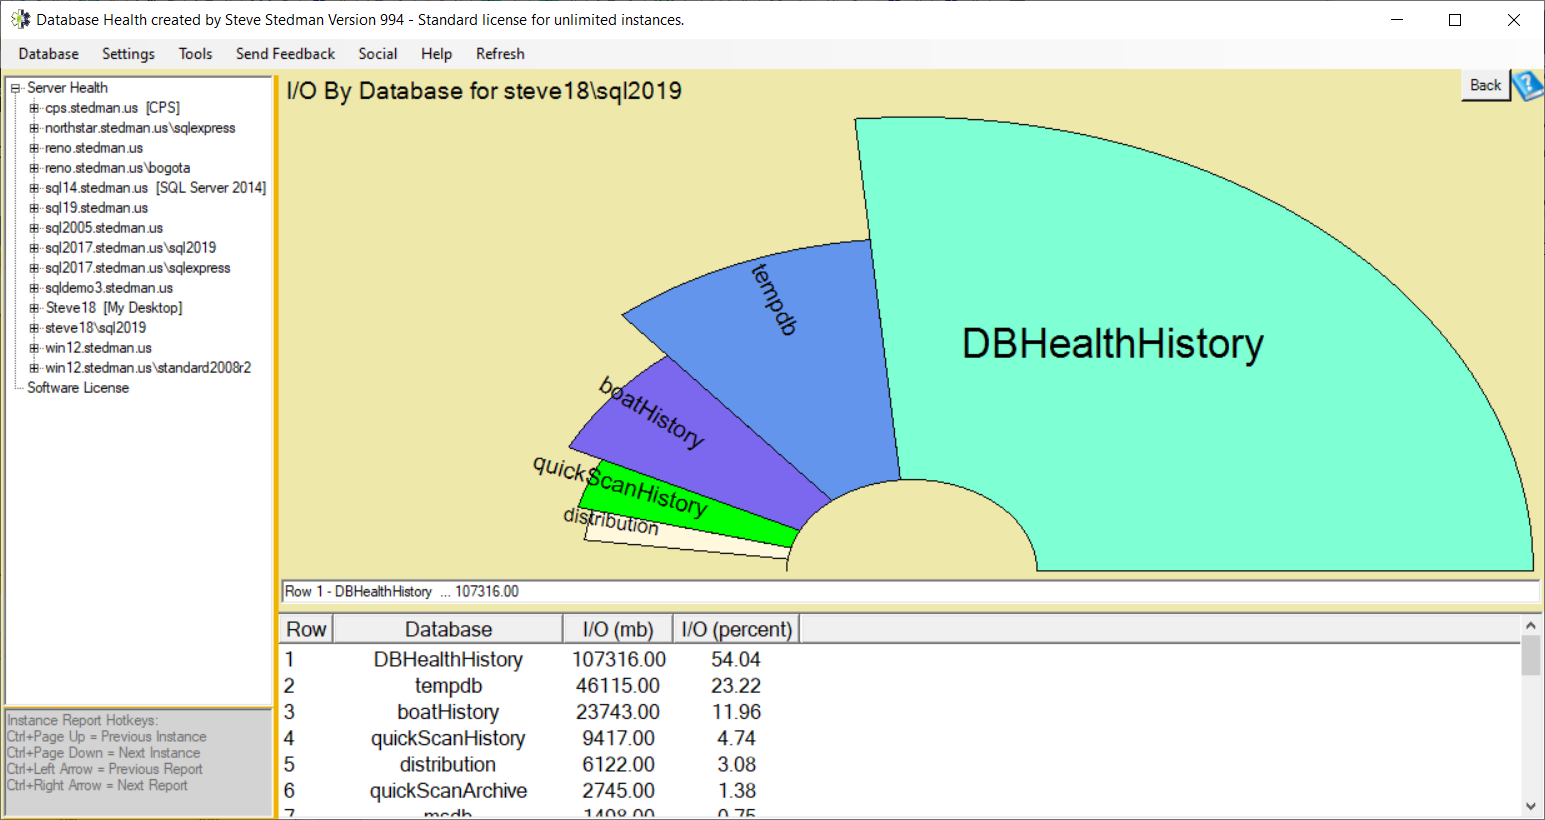
The I/O By Database report is one of the instance level reports available in Database Health Monitor. The I/O by database page shows the databases… Read More »Day 8 – I/O By Database