Monitoring is another important preventative measure that can help ensure the ongoing health and performance of a SQL Server. Administrators should monitor various performance metrics such as CPU usage, memory usage, disk usage, and network traffic to identify performance bottlenecks and potential issues. Monitoring can also help detect and resolve issues related to query performance, execution plans, and blocking sessions.
Database Health Monitor is the tool that I have built over the last dozen years in order to do this type of monitoring and to get a better understanding for how your databases are working.
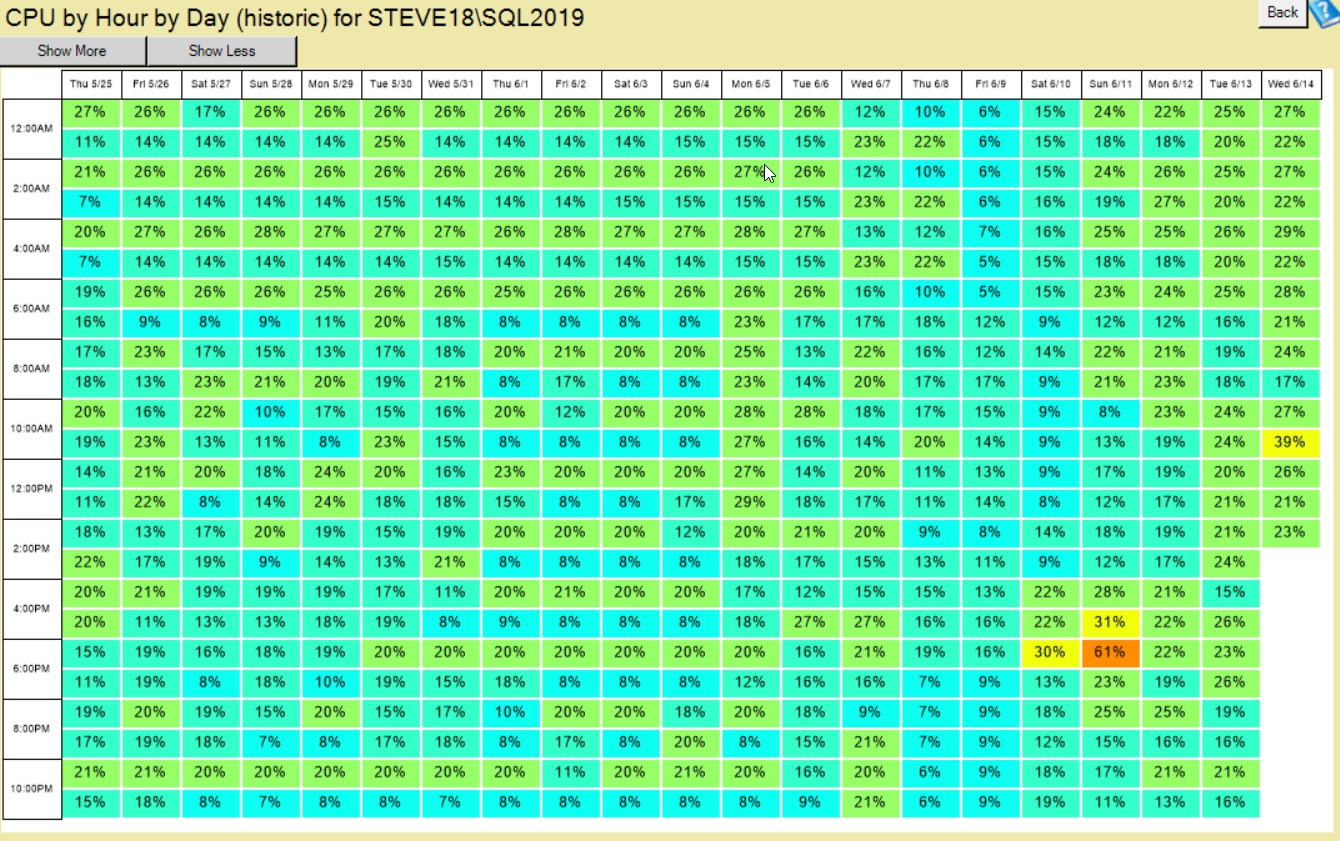
Here are a couple examples of the reports that I use when I am trying to find out why things are running slow. Do you want to schedule a CPU intensive job and need to find the right time during the day to run it, this report can help with that.

The CPU by hour report is great to see the overall CPU utliization averaged out on an hour by hour basis. It is a heat map type report where the larger percentabes are show in in colors closer to red and the smaller numbers are in green.

The memory report is great to find out what SQL server has actually allocated its memory to. Is it a big database, or even worse does a big database only get a tiny amount of memory. This report is handy to help show if a server is doing great with its currrent memory allocation or if it is in need of an increase in memory.
The course comes with licensing for 10 or 20 SQL Servers, and at 25% off it is a great deal if you purchase this month.
25% Off Database Health Monitor Course in July!
Coupon Code: JULY25
Learn how to monitor your wait statistics, you blocking queries, and to find out the best ways to improve performance with what you learn.
More from Stedman Solutions:

Steve and the team at Stedman Solutions are here for all your SQL Server needs.
Contact us today for your free 30 minute consultation..
We are ready to help!

