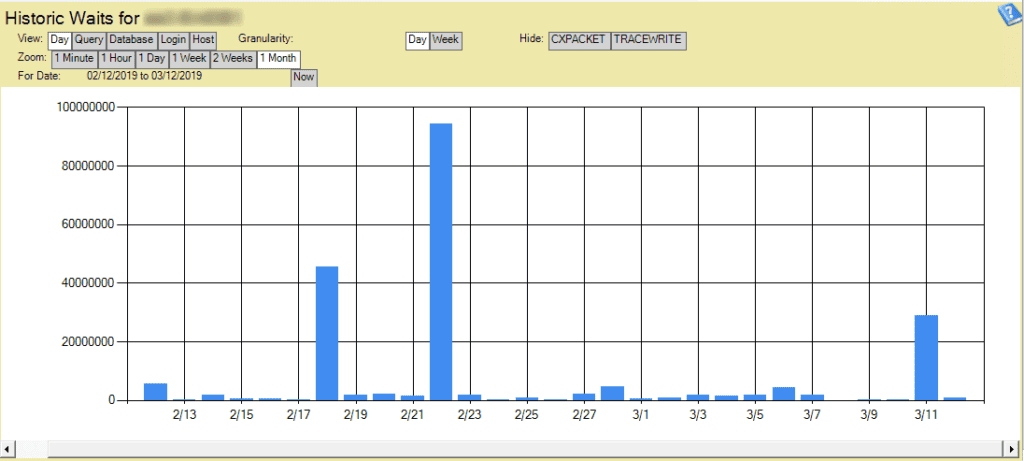
What kind of load does the historic monitoring put on the SQL Server?
It is my opinion that the historic wait monitoring is perhaps one of the most valuable features in Database Health Monitor. You can use it to see how thing are changing over time on your system. You can even answer questions like “The server was running slow last Thursday at 10:45am, can you tell me why?” You can click on the bar chart and drill down to the hour and even the minute to see exactly what was waiting.

Over time there has been some concern over how the historic monitoring works.
There is a job that runs about once a minute that looks at what queries are having waits, and the job logs that information into a small database called DBHealthHistory. Over time that data is then rolled up and compacted so that the second month of data takes up far less than the first, and so on. You still have good granularity for the recent events, but you many only have the hourly data for a month ago.
What type of load does this monitoring put on the SQL Server? Like any experienced DBA would say, it depends. It is usually less than 1% of the overall CPU, and I have never seen it use more than 3% of the CPU load.
If you are using the historic monitoring correctly, you can usually find one or two queries that need fixing that by fixing those you can easily offset the CPU load. The only time that I would be concerned is that if your SQL Server was running continuously at 100% CPU utilization. But if that is the case, I would be even more concerned about other things like finding out why, or upgrading the server.
For most servers that have less that 90% CPU utilization, you will not likely even notice any extra load by the Database Health Monitor historic wait monitoring.
If you concerned with the size of the monitoring database, or the CPU load you can turn off the monitoring or adjust the retention time for the historic data from from the settings dialog:

More from Stedman Solutions:

Steve and the team at Stedman Solutions are here for all your SQL Server needs.
Contact us today for your free 30 minute consultation..
We are ready to help!
Hello Steve,
Hope you had good week so far. I am getting the below error whenever I am test the connection for the HistoricDB on only one of the servers but not others.
Also I can see that the Login DBHealthUser is not getting created after successfully configuring the Historic database.
Thanks,
Sai
Starting test…
1. Testing HistoricDB connection (MYDOMPRDSQL02).
HistoricDB connection is good.
2. Testing configuration for (MYDOMPRDSQL02).
ERROR: Database configured multiple times.
Hello Sai –
You will want to look at the table [dbo].[instanceMonitor] in the DBHealthHistory database.
SELECT *
FROM [DBHealthHistory].[dbo].[instanceMonitor]
Then look for multiple configurations for the same instance, and delete one of them.
That should clear up the multiple instance configuration issue.
-Steve Stedman
Steve, your tool is awesome. I love telling others about it.
And I would love to leverage this Historic Wait feature–it too is a feature I praise and recommend to others.
But for my own server, I just run SQL Express, and as you know that doesn’t run the SQL Agent, and so when trying to test the connection in your tool, it reports that because of this, the feature can’t work.
First, do you know of ANY way around this? I don’t mean other than buying a SQL license. I mean first, “any way to get this to work without requiring the agent?”, or perhaps “any way to run some 3rd party agent equivalent that you could use?”, or perhaps “any way to have you store the data elsewhere, that doesn’t rely on the agent”?
If you may have any resources that have in the past elaborated on the requirement for the agent, perhaps we in this situation could better understand it. I realize there may be no solution. But again I ask for the sake not just of my own server but others who may be running Express and yet could benefit from this feature in your tool, if it could be made to work for us.
Again, though, thanks very much for the tool. It’s a wonderful resource, as are you!
Charlie – you could use a windows scheduled task that connects to the database and runs the monitoring procedure. I have used that before on express edition when there is no agent.
Just run this one a minute from a scheduled job.
EXECUTE [DBHealthHistory].[dbo].[dbHealthHistoryMonitor] @numberOfLoops = 1;
-Steve Stedman
That will be great, if it works out. (not. At. Computer to try.)
Indeed, you may want to add some sort of technote, and link to that from the ui (where for now, it just reports we can’t use the feature without the agent). Many may not connect the dots on their own.
Hope that’s helpful. Thanks for all you do.