 It has been a long day, but I was able to get the latest Beta release of Database Health Monitor out. If you haven’t heard of Database Health Monitor monitor before, here is the quick rundown. It is a set of performance monitoring reports and tools to help you get more performance out of your SQL Server. Database Health Monitor is a project that I have been working on since October of 2011, each year improving the overall feature set.
Since starting my freelance consulting business (Stedman Solutions, LLC), Database Health Monitor has been incredibly valuable in working with new clients and quickly getting an understanding of the overall health and status of their SQL Server. Just today I used it the Historic Waits monitoring with a customer to track down a very serious problem. If I had not had the tools and reporting in the Database Health Monitor, it would have been a very different scenario to track down the problem.
Historic Waits
There were some improvements in this version relating to the Historic Wait monitoring. This is a component that when enabled, created a small database to keep track of what waits are occurring on your SQL Server at all times. Previously you could only use a single centralized server for the monitoring, now you have much more flexibility, you can use any SQL Server to monitor another SQL Server.
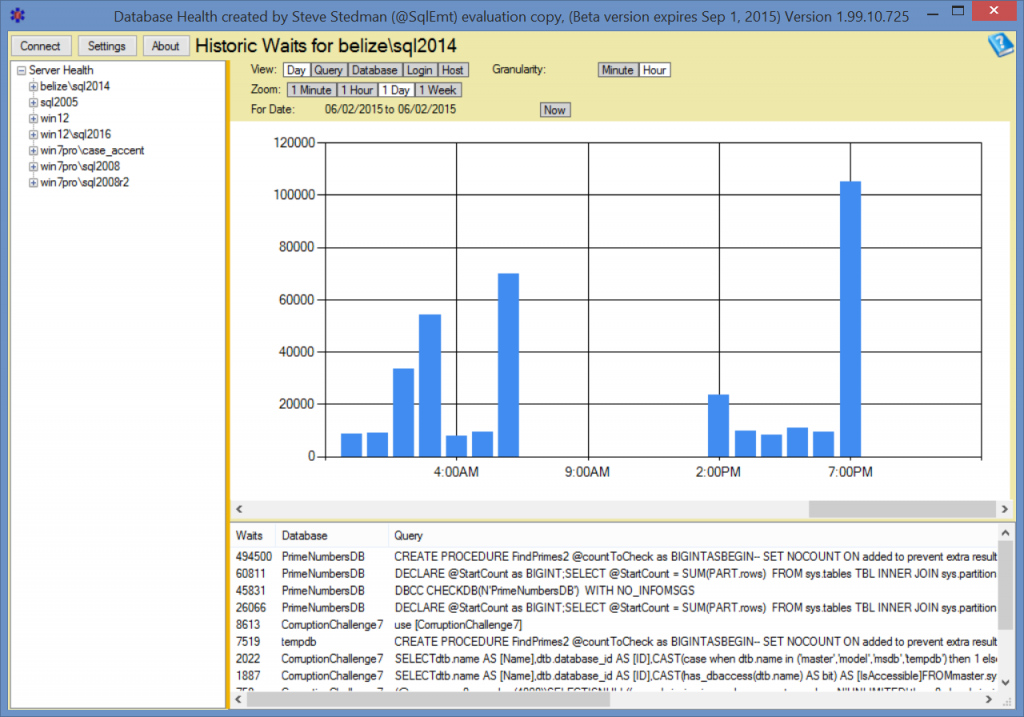
Here is an example of the waits report that is currently analyzing my entire server. From this report you can see that the top 4 queries causing the most waits are in the PrimeNumbersDB followed next by a query in the CorruptionChallenge7 database.
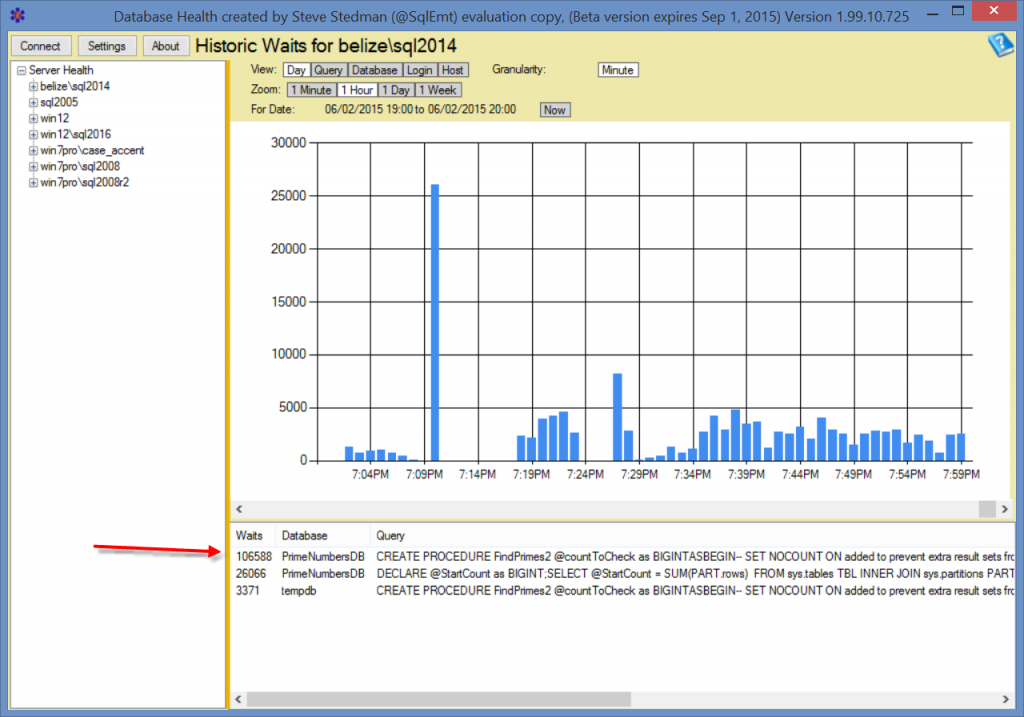
From there you can drill down into the 7:00pm slot to get more details on what exactly happened at that point. From here you can see that something different was happening at 7:10pm.
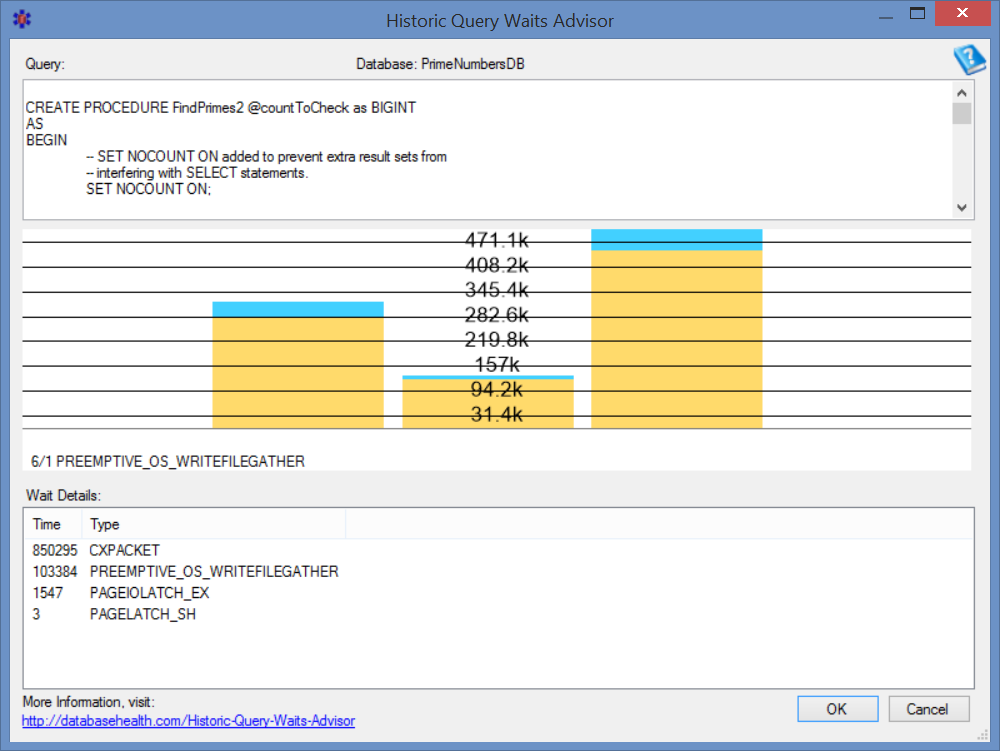
Drilling down even further you can see the exact query causing the waits, you can see what type of waits there have been day over day.

With the historic monitoring tool it is quick and easy to find out what was going on with your database at some point in time.
It used to drive me crazy when someone would say “The database was slow last Thursday at 3:30pm, can you find out what caused it to be slow?” With the historic wait monitoring feature in the Database Health Monitor you can easily answer those type of questions.
Historic monitoring is just one of the many features in the Database Health Monitor.
Free – Did I hear free?
Yes, the Database Health Monitor is a FREE tool that I share with the SQL Community. There is no charge to use it, however users can get a registration code by simply registering for my newsletter list.
Enjoy
-Steve Stedman
More from Stedman Solutions:

Steve and the team at Stedman Solutions are here for all your SQL Server needs.
Contact us today for your free 30 minute consultation..
We are ready to help!

