After the last post on Cumulative Distribution Function (CDF) or as it is known in TSQL CUME_DIST(), I realized that although I showed how to use it, I didn’t really explain what it means, or when to use it. That is where this example comes in.
First lets take an example that generates simulated dice rolls. What are the odds that when you roll two six sided dice that the number will come up a 12 or a 2 compared to a 6, 7 or 8. Lets look at an example.
First off two ways to do this; First I could use the Rand() function to generate numbers between 2 and 12. Given that the Rand() was truly random that would show that the odds are exactly the same for any number between 2 and 12, but that is not the way that dice behave.
Instead the right way to do it is to use the Rand() function twice to simulate two dice rolling numbers between 1 and 6, then add the two together. Here is how we do that in TSQL.
GO
USE [analytics_demo];
GO
CREATE TABLE DiceRolls
(
 [FirstDie] int,
 [SecondDie] int
);

GO
set nocount on;
DECLARE @maxRandomValue int = 6;
DECLARE @minRandomValue int = 1;

insert into DiceRolls
values(Cast(((@maxRandomValue + 1) - @minRandomValue) * Rand() + @minRandomValue As int) ,
 Cast(((@maxRandomValue + 1) - @minRandomValue) * Rand() + @minRandomValue As int));

GO 1000

set nocount off;
SELECT FirstDie + SecondDie as TotalRoll FROM DiceRolls;
When you run this you will see that your results of the final SELECT statement are numbers between 2 and 12.
Looking that the 30 results that you see above, that is not a statistically significant number of rolls to determine the probability of each roll combination. But the table contains 100 rows, so lets take a look at it with CUME_DIST().
SELECT distinct TotalRoll,
 CUME_DIST() OVER (ORDER BY TotalRoll) as CumulativeDist
FROM (SELECT FirstDie + SecondDie as TotalRoll FROM DiceRolls) as t
order by TotalRoll;
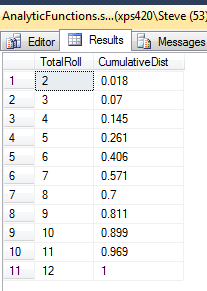
Which produces the following output:
Which tells you that the odds of rolling a 2 are 0.018 or just short of 2%. The odds of rolling a 3 or less are 7% but the odds of it being a 3 are 7% – 2% = 5%. So if you were betting on the roll of the dice you could see that it is more than twice as likely to roll a 3 as it is a 2.
Next we take the results and drop it into Excel to create the chart below, where the steeper the line, the more likely it is to be rolled, and the flatter the line, the more unlikely it is to be rolled.
From this you can see that the numbers in the middle of the range 6 to 8 are more likely to be rolled than the outside of the range 2 to 12. The reason for that is that when rolling 2 six sided dice, there is only one combination that will produce a 2, and there are different combinations that will produce a 3, and even more combinations to produce a 7.
2: 1+1
3: 1+2 or 2+1
4: 1+3 or 2+2 or 3+1
5: 1+4 or 2+3 or 3+2 or 4+1
6: 1+5 or 2+4 or 3+3 or 4+2 or 5+1
7: 1+6 or 2+5 or 3+4 or 4+3 or 3+4 or 5+2 or 1+6
8: 2+6 or 3+5 or 4+4 or 5+3 or 6+2
9: 3+6 or 4+5 or 5+4 or 6+3
10: 6+4 or 5+5 or 4+6
11: 5+6 or 6+5
12: 6+6
Which shows that 7 is the most probably roll. Now lets change the query a bit to see what we can come up with that would look more like our list above:
</pre>
SELECT CD.TotalRoll, CD.CumulativeDist, isnull(LAG(CD.CumulativeDist) OVER(ORDER BY TotalRoll), 0) as LastCumulativeDist
from ( SELECT distinct TotalRoll,
 CUME_DIST() OVER (ORDER BY TotalRoll) as CumulativeDist
 FROM (SELECT FirstDie + SecondDie as TotalRoll FROM DiceRolls) as t) CD
order by TotalRoll;
<pre>
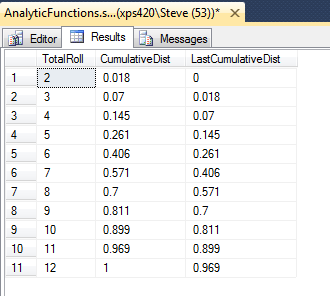 Using the LAG and OVERclause we are able to look at both the probability of the roll being less than or equal the current value, and the less than or equal to the previous value. Which isn’t that useful until we do some math…
</pre>
SELECT CD.TotalRoll, CD.CumulativeDist - isnull(LAG(CD.CumulativeDist) OVER(ORDER BY TotalRoll), 0) as OddsOfThisRoll
from ( SELECT distinct TotalRoll,
 CUME_DIST() OVER (ORDER BY TotalRoll) as CumulativeDist
 FROM (SELECT FirstDie + SecondDie as TotalRoll FROM DiceRolls) as t) CD
order by TotalRoll;
<pre>
Now we can see that the odds of rolling a 2 are 1.8%, and the odds of a 7 are 16.5%. Where it gets interesting is that if you compare 6 and 8 which should have the same number of combinations the 6 has odds of 14.5% and the 8 has odds of 12.9%, which doesn’t sound right. This is perhaps because we don’t have a large enough set to be statistically significant.  So now to run the code for the roll 10,000 times lets see if the odds change
</pre>
-- to 10,000 rolls
delete from DiceRolls;
GO
set nocount on;
DECLARE @maxRandomValue int = 6;
DECLARE @minRandomValue int = 1;

insert into DiceRolls
values(Cast(((@maxRandomValue + 1) - @minRandomValue) * Rand() + @minRandomValue As int) ,
 Cast(((@maxRandomValue + 1) - @minRandomValue) * Rand() + @minRandomValue As int));
GO 10000
set nocount off;

SELECT CD.TotalRoll,
 round((CD.CumulativeDist - isnull(LAG(CD.CumulativeDist) OVER(ORDER BY TotalRoll), 0)) * 100, 1) as OddsOfThisRoll
from ( SELECT distinct TotalRoll,
 CUME_DIST() OVER (ORDER BY TotalRoll) as CumulativeDist
 FROM (SELECT FirstDie + SecondDie as TotalRoll FROM DiceRolls) as t) CD
order by TotalRoll;
<pre>
Which brings the odds closer together. 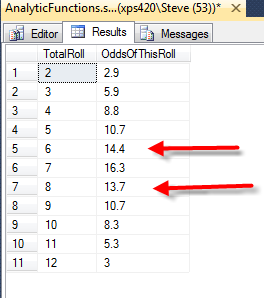 But the still aren’t the same for 6 and 8 there are the same for 5 and 9, but not for 4 and 10 or 3 and 11 or 2 and 12. So lets push it out to 100,000 simulated dice rolls.
 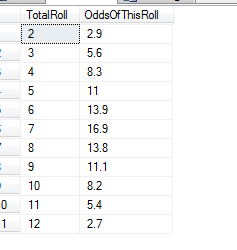 Which brings the odds for 6/8, 5/9, 4/10, 3/11 and 2/12 closer together, but still not exactly the same. Lets move it on to 1,000,000 simulated dice rolls
</pre>
-- to 1,000,000 rolls
delete from DiceRolls;
GO
set nocount on;
DECLARE @maxRandomValue int = 6;
DECLARE @minRandomValue int = 1;

insert into DiceRolls
values(Cast(((@maxRandomValue + 1) - @minRandomValue) * Rand() + @minRandomValue As int) ,
 Cast(((@maxRandomValue + 1) - @minRandomValue) * Rand() + @minRandomValue As int));
GO 1000000
set nocount off;

SELECT CD.TotalRoll,
 round((CD.CumulativeDist - isnull(LAG(CD.CumulativeDist) OVER(ORDER BY TotalRoll), 0)) * 100, 1) as OddsOfThisRoll
from ( SELECT distinct TotalRoll,
 CUME_DIST() OVER (ORDER BY TotalRoll) as CumulativeDist
 FROM (SELECT FirstDie + SecondDie as TotalRoll FROM DiceRolls) as t) CD
order by TotalRoll;
<pre>
You can see that the more times we roll the simulated dice we get closer and closer to matching numbers for the 6/8, and other numbers that should have the same odds. 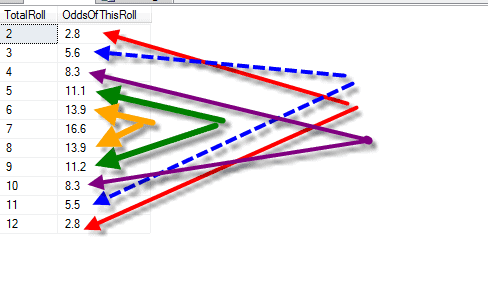
Next lets take the output and drop it into Excel to see what the curve looks like.
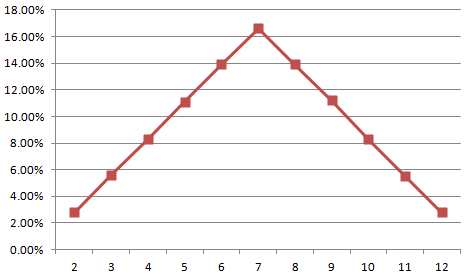 Not exactly a bell curve, but you can see that the odds of rolling a seven is just over 16% which is the most likely roll.
That’s it for statistics for today with CUME_DIST in TSQL on SQL Server 2012. I hope this helps you to understand what you can do with CUME_DIST on SQL Server. This is one of my favorite new Analytics functions.
More from Stedman Solutions:

Steve and the team at Stedman Solutions are here for all your SQL Server needs.
Contact us today for your free 30 minute consultation..
We are ready to help!

