Earlier today I had the opportunity to release the September update of Database Health Monitor. This is version 2.91.
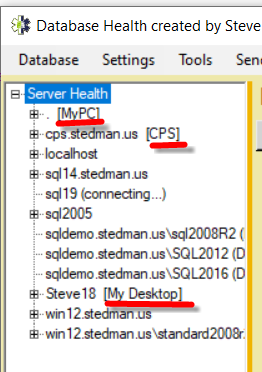
One of the updates is a new feature called aliasing, where you can add a tag to the name of the server in the tree view on the left hand side as shown in the picture below. The first database in the list was just connected to as . (period) to reference the local machine. I right clicked, and add the alias of “MyPC” to better describe the link. The CPS alias and My Desktop alias were also added.
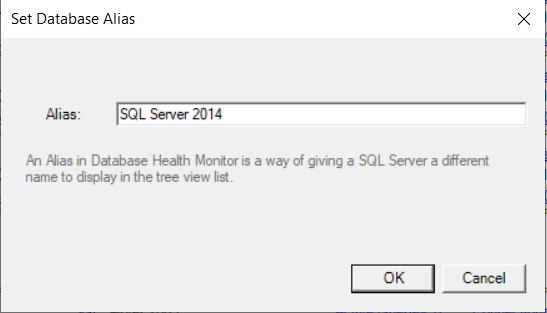
To add an alias you just right click on the Server name in the tree view and choose the option to add an alias, and enter the alias name as shown below.
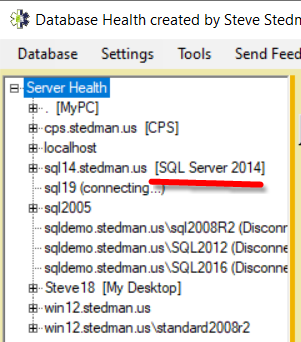
Once added, the new alias will look like this:
Here is the full list of changes in the last 2 updates, you can download it today and give it a try.
Version 2.9.1 Release Notes
Version 2.9.1 is the September release of Database Health Monitor.
New Features in 2.9.1
- Added a check to the QuickScan report for SQL Server Express database files approaching the 10GB limit.
- Adding Aliasing for servers, or a way to add a tag name to the server as it is displayed in the list view. Useful for associating machine names with IP addresses. Requested by a customer.
- Adding keypad + and keypad – hotkeys for the grid views to increase and decrease the font size.
Bug Fixes in 2.9.1
- Fixed a bug with the wrong compatibility level being detected for databases names that started with a number. This prevented the fragmented indexes report from being shown for databases names that started with a number.
- Fixed a bug in the Most Used indexes report with an overflow error on really busy indexes.
- Fixed a bug where a certain combination of quotes in a password caused the connect string to fail and not be able to connect with that password.
- Fixed a bug, the CheckDB screen was displaying an incorrect (outdated)icon.
- Fixed bug relating to the display of the SQL Server version on the main panel. For longer version names it was being wrapped and chopping of the display of the version number.
- Fixed a bug with the clickability of the chart on the historic waits charts. For really short bars they were hard to click. Now clicking just above the bar also acts as a click on the bar.
Version 2.9 Release Notes
New Features in 2.9
- Added a new Blocking Heat Map report that shows by day and by hour when blocking is occurring.
Bug Fixes in 2.9
- Fixed bug with extra buttons on the all servers reports “System Overview” and “Dashboard” show the same thing. I removed system overview.
- Fixed bug when clicking on FAILED JOBS and there are no failed jobs, the presentation is a little weird with overlapping controls.
- Fixed a customer reported bug in the Missing Indexes advisor where when adding indexes with both inequality and equality columns there was a missing comma in the index creation script.
- Fixed bug with clicking on CPU LOAD BY HOUR I can click SHOW MORE until the button disappears. However, there’s more data. If I click CTRL PAGEDOWN to go to the next instance and CTRL PAGEUP to go back to the original instance the SHOW MORE button is there
- Fixed a bug with the Blocking Query Monitor where it was attempting to connect to the DBHealthHistory database and sometimes throwing an error. Changed the connection to master since the DBHealthHistory database is not needed for this feature.
Download Database Health Monitor today and give it a try.
More from Stedman Solutions:

Steve and the team at Stedman Solutions are here for all your SQL Server needs.
Contact us today for your free 30 minute consultation..
We are ready to help!