SQL Server Performance Tuning Tips – Wait Statistics
Wait statistics are commonly overlooked ways to quickly find out what is causing your SQL Server to be slow. One of the reasons is it’s difficult to see how they are trending over time.
>>> It is not difficult with a monitoring tool. <<<
When someone reports a slow database yesterday at 2:00pm, do you know how to determine what’s causing it? You can check the logs, you can look at the history of running jobs, and you might even ask around to see if anyone was doing anything unusual at that time. If you are tracking wait statistics, it is quick and easy to zoom in on a point in time and see exactly what queries were slow and why they were slow.
You might be thinking the following:
- Did someone run a slow ad-hoc query?
- Was there something wrong with the network?
- Did someone run an unscheduled SSIS ETL package?
- Was an index being rebuilt?
- Did someone change application code?
- Was there a hardware failure of some kind?
- Was DBCC CheckDB running?
What are Wait Statistics
Whenever SQL Server is waiting for something to happen it logs that information as a WAIT.
What type of things get logged:
- If your SQL Server is waiting on I/O.
- If it’s waiting on network traffic to another SQL Server.
- If your database is waiting on a transaction to complete.
Most everything that SQL Server waits on gets logged. However this information doesn’t stay around for long.
If this is your first exposure to using wait statistics, it’s too late to install on monitoring tool, and jump back in time to see what was going on with your SQL Server. However it’s NOT too late to install a monitoring tool so next time you will be ready!
You can spend a bunch of money on a tool from some of the big vendors, or you can build your own solution with some stored procedures scheduled jobs and some charting. There is a third option available, (free to connect to 1 server) a SQL Server performance tuning tool that I have created, called Database Health Monitor. One part of the Database Health Monitor is component called Historic Wait Monitoring, which installs a small database, and a scheduled task to monitor your wait statistics.
Here is how you set it up:
Step1: Download and install Database Health Monitor
Visit http://DatabaseHealth.com/download and download the latest version. Run the install program. Once installed, start up Database Health Monitor. Take a look around at some of the real time reports. Once you have familiarized yourself with the program, you are ready to try out the Historic Monitoring Feature.
Step 2: Turn on Historic Wait Monitoring
To monitor your wait statistics, you will need to turn on the Historic Wait Monitoring feature of Database Health Monitor.
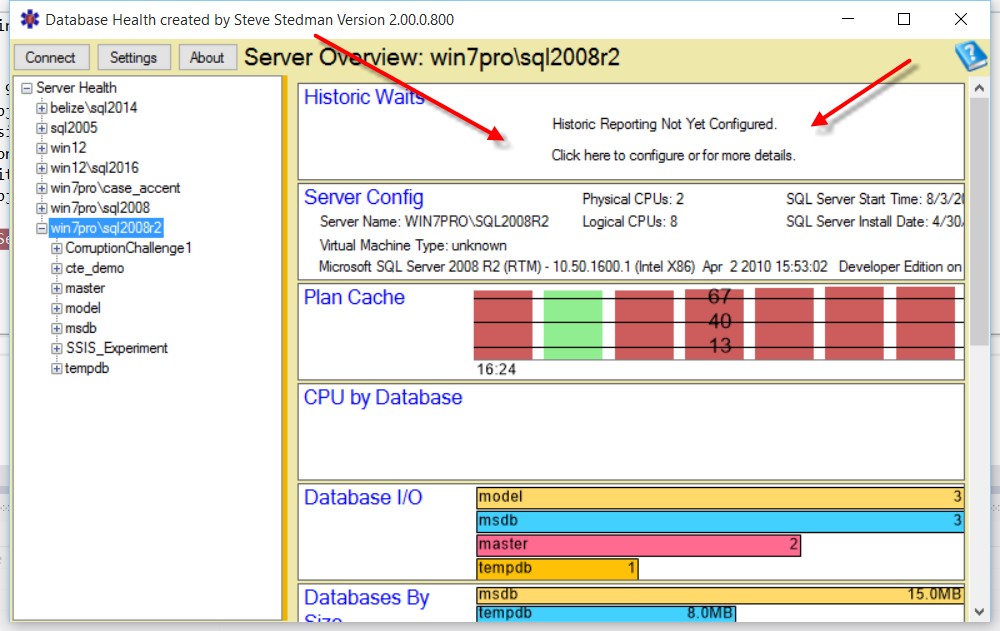
Prior to turning on Historic Wait Monitoring, you should see a panel that states “Historic Reporting not yet configured, Click here to configure…”.
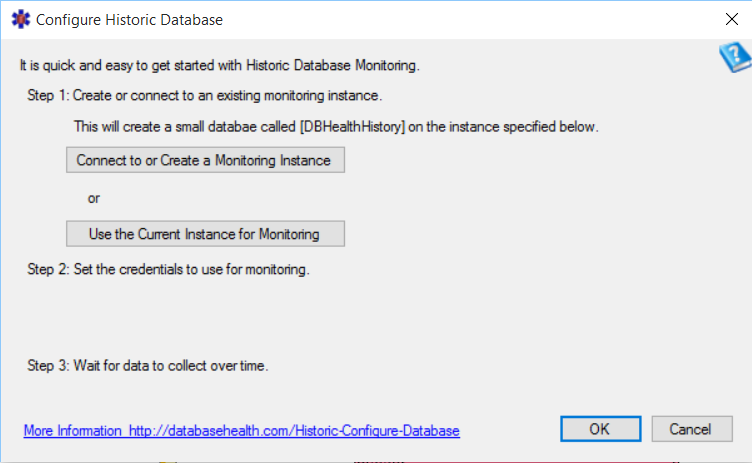
Just click on the Historic Waits Panel and you will be prompted to either connect to a different server to use for the monitoring, or to use the current server. This choice will determine where the small tracking database, and scheduled job will be installed. Choose either of those, if it is your first time using wait stats and you just want to try it you may want to just use the current instance. Don’t worry you can always change this later.
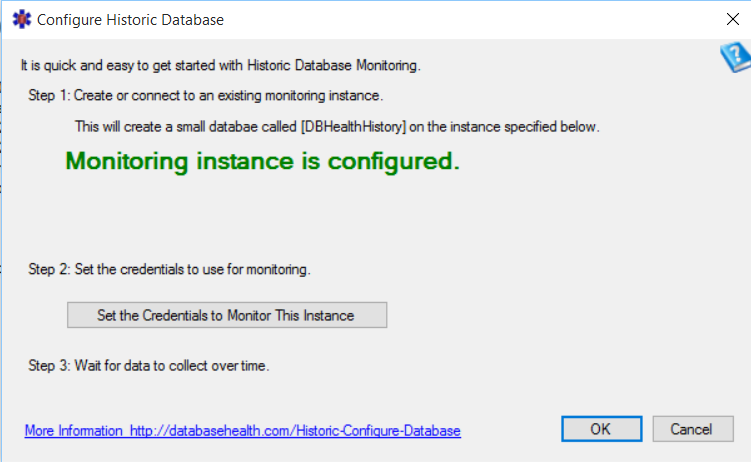
Next you set the credentials the job will use to monitor this database. This monitoring will occur continuously 24 hours a day 7 days a week. It will add a minor (2% to 4%) load to your SQL Server.
Once you have specified the credentials, the job will monitor for a while. Sometimes you will start to see wait information in just a few minutes, other times it takes several hours, it all depends on the load on your SQL Server.
Step 3: Check Back Later
After a while of collecting wait statistics, you will have some meaningful data to use for your SQL Server performance tuning work.
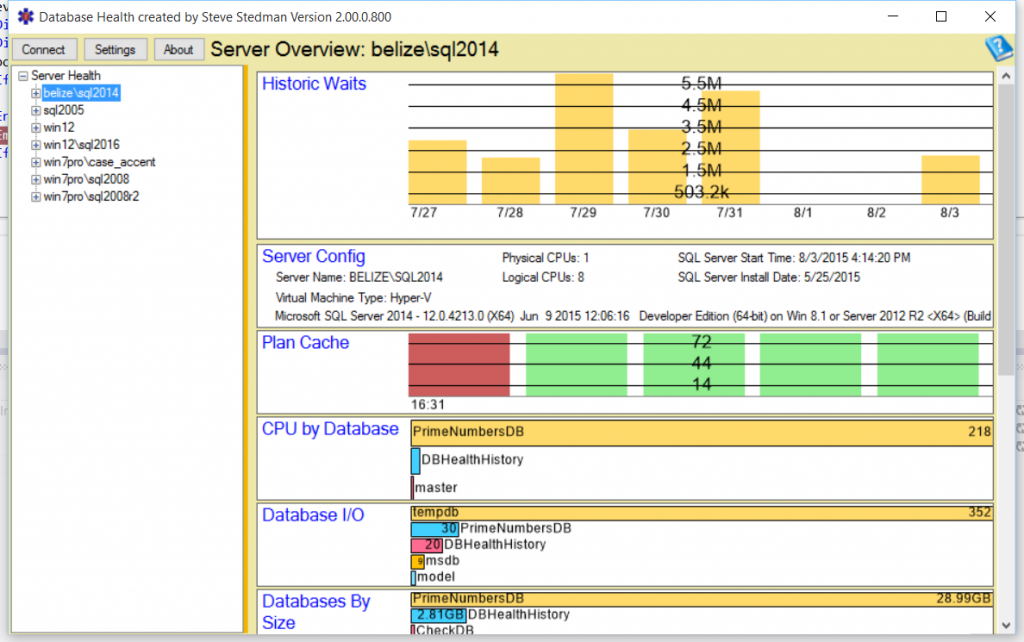
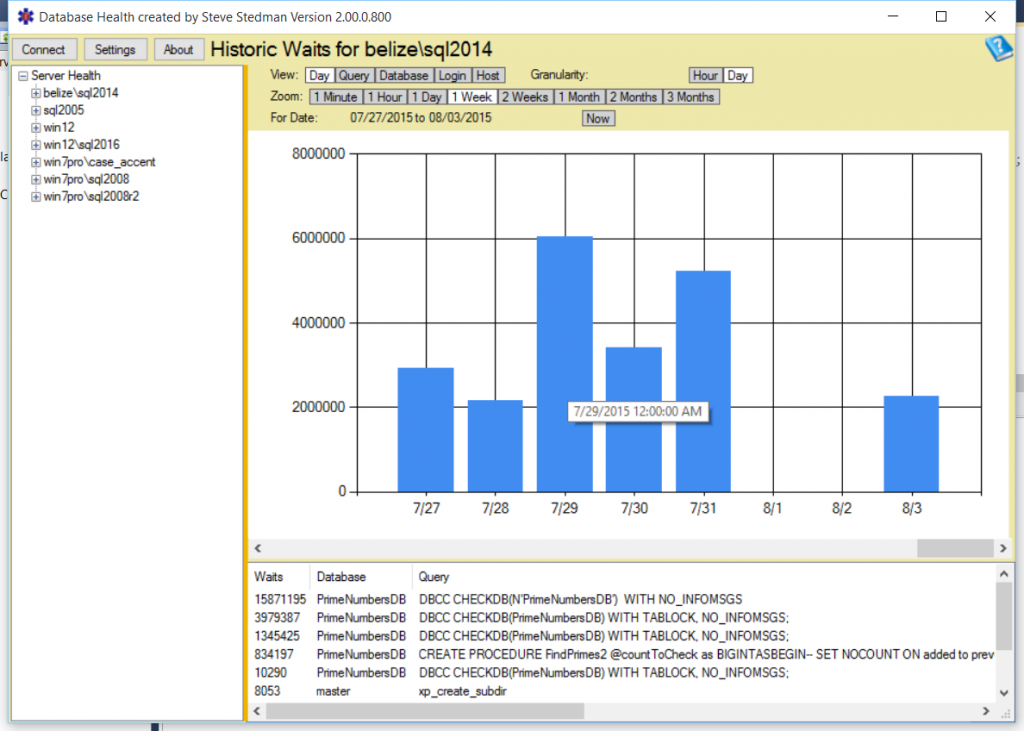
When you check back later, you should see a day by day chart showing the history of waits on the database or SQL Server instance.
You can start by clicking in the instance name in the tree view, then clicking the historic waits chart. The wait statistics chart will look something like this:
From this point, you can drill down on the wait statistics for a specific day, or even down to the second to see what was causing your SQL Server to wait on something.
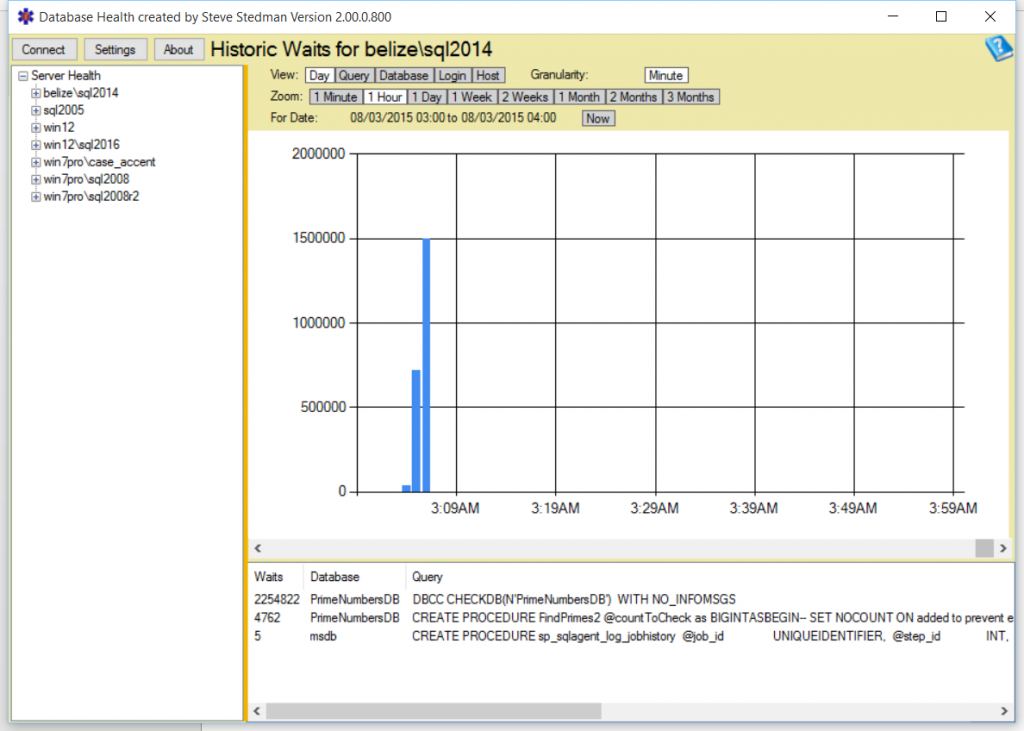
For instance if I drill down on a day, I can see that there were quite a few waits occurring around 3:00 am. Specifically at 3:05am in this case.
Here you can see the top queries causing waits at that point in time were on the PrimeNumbersDB. Double clicking on the top query shows the following chart to see the wait types caused by the DBCC CHECKDB query in this case.
Most of the waits on this one are CXPACKET which indicates that a multithreaded operation is waiting on other threads to complete. The CXPACKET is usually a benign wait, and not the true symptom of a problem.
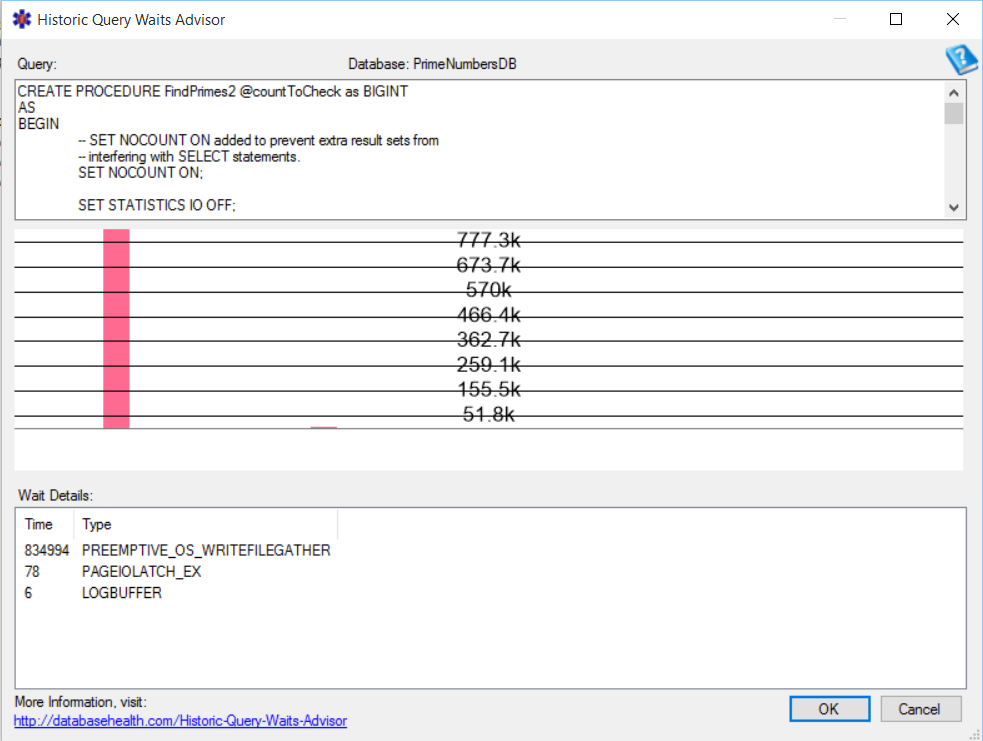
Clicking on the second query shows different results, specifically on the PREEMPTIVE_OS_WRITEFILEGATHER, PAGELATCH_EX, and LOGBUFFER wait types. This PREEMPTIVE_OS_WRITEFILEGATHER is an indication that the database is waiting when it is attempting to write.
With these tools, over time you can track down what queries are causing the most waits, and you can focus on the right thing to solve those slow queries with the most wait types.
Step 4: Repeat Regularly
Repeating this process regularly will help you better understand your wait statistics base line, as well as to see when something pops up that you weren’t expecting.
Need Help?
Need help with SQL Server Performance tuning or to just better understand your wait statistics Stedman Solutions can help.
Part of the services offered by Stedman Solutions, LLC focus on SQL Server performance tuning. We can help track down and diagnose your SQL Server performance problems. Contact us today for a free 30 minute consultation.
Related Links
More from Stedman Solutions:

Steve and the team at Stedman Solutions are here for all your SQL Server needs.
Contact us today for your free 30 minute consultation..
We are ready to help!



Hi,
I tried to use your tools but i have an issue during the creation of database monitor. Create LDF file encountered system error. In spite of i have sysadmin rights and i’m administrator of OS.
Can you help me please?
Thanks.
Regards,
Tarek.
Tarek,
Thanks. I have made some changes to how the historic monitoring database gets created. There will be a new update out in a couple weeks that should fix this.
-Steve