One big new feature in Beta 3 of the Database Health Reports, the historic monitoring.
The way that the historic monitoring works is that it continuously monitors your SQL Server database and logs the details around queries that are causing waits.
Here is an example, the following ugly block of TSQL updates a table with a few million rows in it, and that table has about 20 indexes on the primary key of a unique identifier. Like I said ugly, ugly, ugly, but this query is quickly detected in the historic monitoring in Beta 3 of the Database Health Reports.
declare @counter as integer;
set @counter = 100;
WHILE @counter > 0
BEGIN
UPDATE dbo.NoLockDemo SET SomeData = NEWID()
set @counter = @counter - 1
WAITFOR DELAY '00:00:00.300'
END
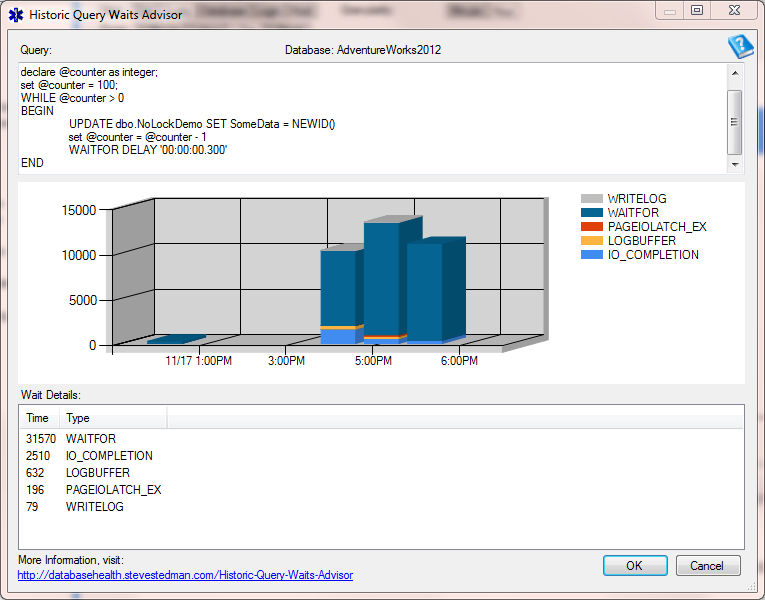
Here is what I discovered using the Historic Waits reporting in Beta 3 of the Database Health Reports.
From here you can see that this query was run a lot between 4:00pm and 6:00pm, and that the wait that caused the most trouble was the WAITFOR wait type, but following that was the IO_COMPLETION, LOGBUFFER, PAGEIOLATCH_EX, followed by WRITELOG.
Once you activate the historic waits reporting, it may take a couple hours to a day to collect the data to be able to see trends like we see here.
The Beta 3 of the Database Health Reports gives you a quick graphical way to track down the queries that may be causing the most pain on your SQL Server.
Download Beta 3 of the Database Health Reports and give it a try.
More from Stedman Solutions:

Steve and the team at Stedman Solutions are here for all your SQL Server needs.
Contact us today for your free 30 minute consultation..
We are ready to help!
