Database Health Monitor – Historic Waits

With the recent release of Database Health Monitor Version 2.0 I have decided to focus on of blogging about the features and benefits of the Database Health Monitor application. There are some incredibly valuable features that are often overlooked. The purpose of this blog series is to present some of the features of the product.
If you haven’t tried Database Health Monitor, you can download it at http://DatabaseHealth.com/download. It is completely free.
Historic Waits
The Historic Waits section of Database Health monitor is in my opinion the single most valuable part of the entire product. Other vendors sell products similar the Historic Waits feature for $1500 to $2000 per SQL Server instance, making it cost prohibitive for many.
The way that Historic Waits works is that it installs a small monitoring database on a SQL Server, that can be the same SQL Server you are monitoring, or it can be a separate SQL Server just to keep track of performance.
Over time data is collected in this monitoring database that allows you to then step back in time to see what was happening with the SQL Server at a specific point in time. For instance, if you have Historic Monitoring enabled, if someone comes to you and says “The SQL Server was slow and having problems at 2:00am yesterday”, you have the ability to track down what was happening at that point in time.
The main Historic overview page shows Waits, Plan Cache Hit Ratio, Page Life Expectancy and CPU Load over time.
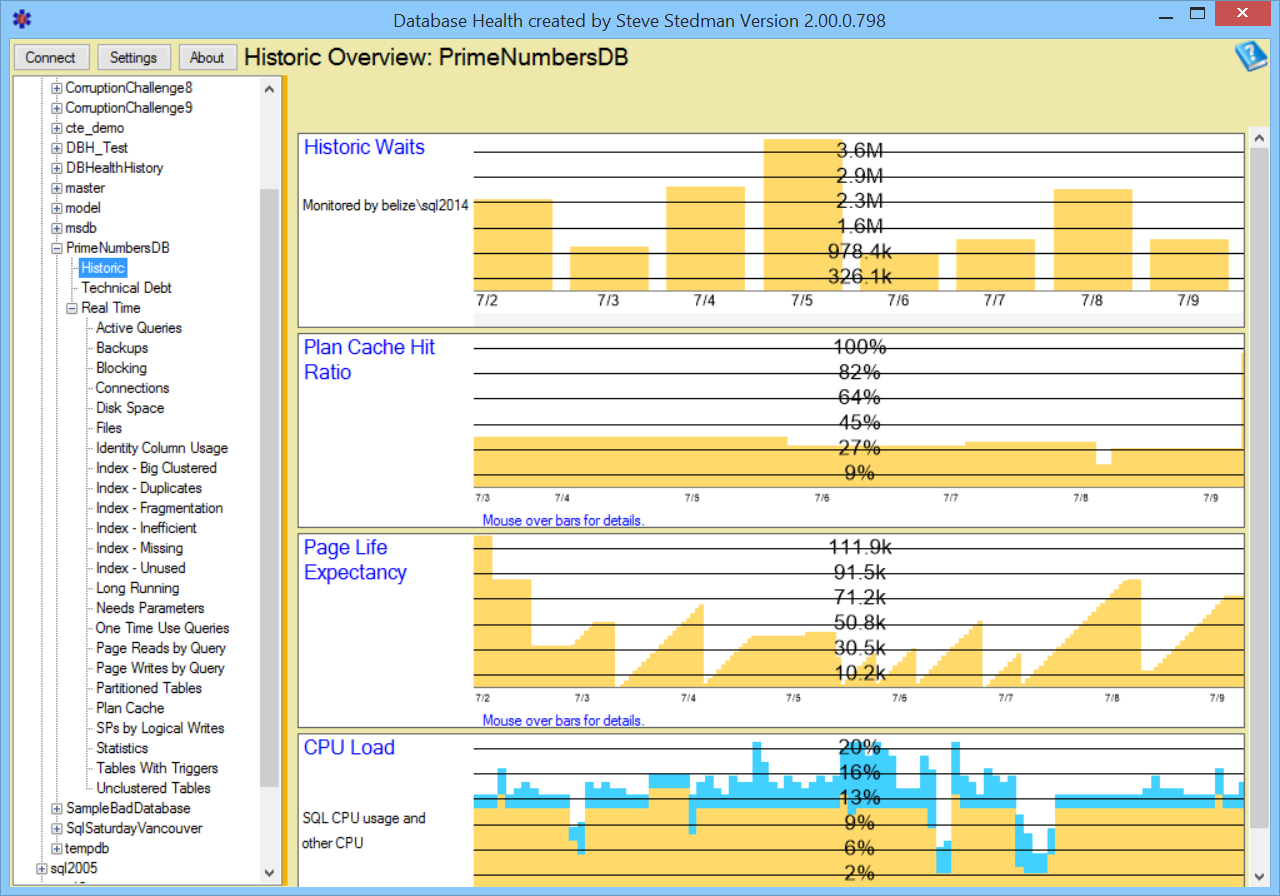
Clicking on the top chart will bring you to the Historic Waits page.
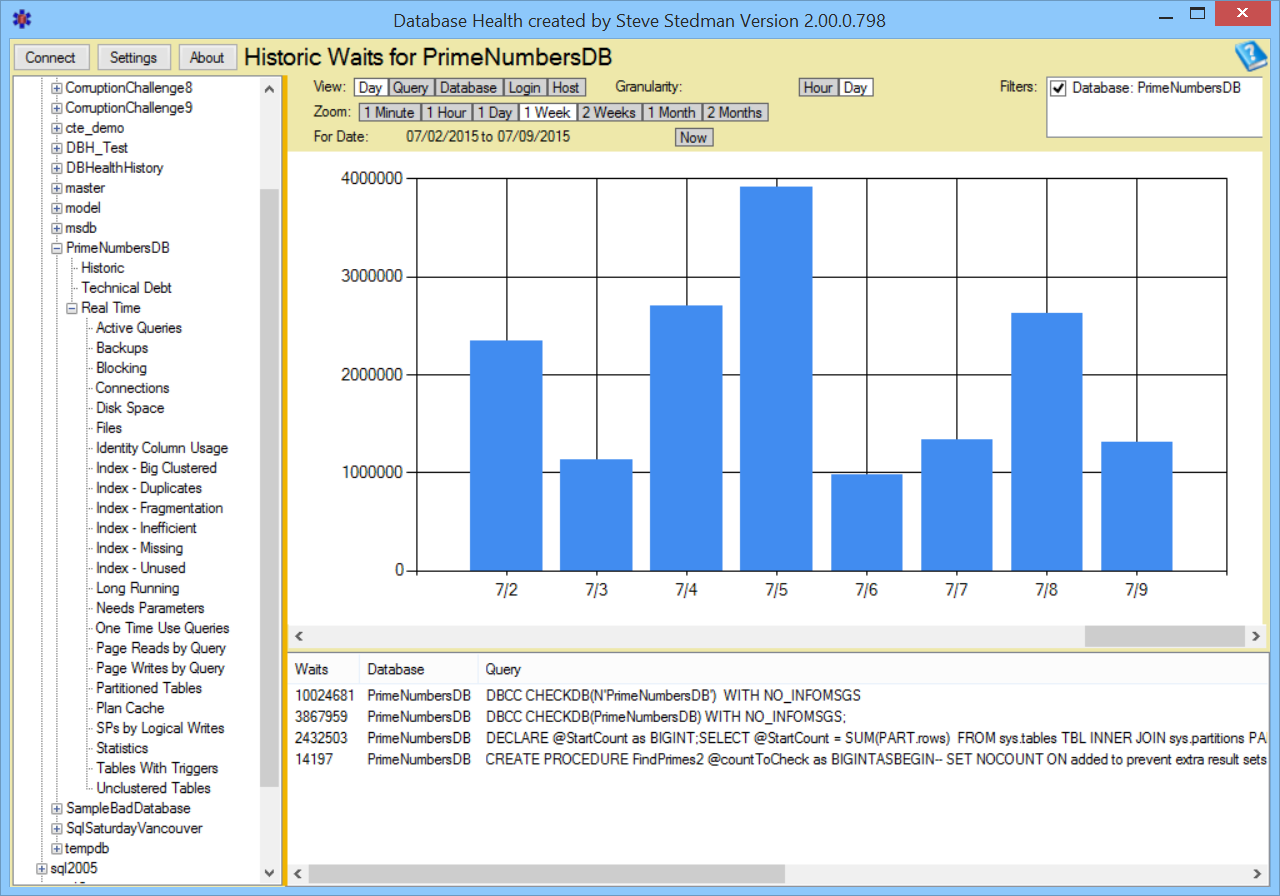 From this page you can see the amount of wait time per day, and a list of the top queries impacted by those waits. You can see that July 5 (7/5) is the day with the most waits for the week shown. Click on July 5 to drill down shows the details for that day.

From this cart you can see that 3:00am, 9:00am and 10:00am there are significant waits, and at 7:00pm that is a small blue bar which shows some waits. Lets click on the 3:00am bar to see what was happening at that point in time.

You can see that all the waits occurred right around 3:05am and 3:06 am. The queries showing the waits are shown at the bottom. Clicking on one of the top two (both DBCC CheckDB) shows what time of waits were occurring related to that query.
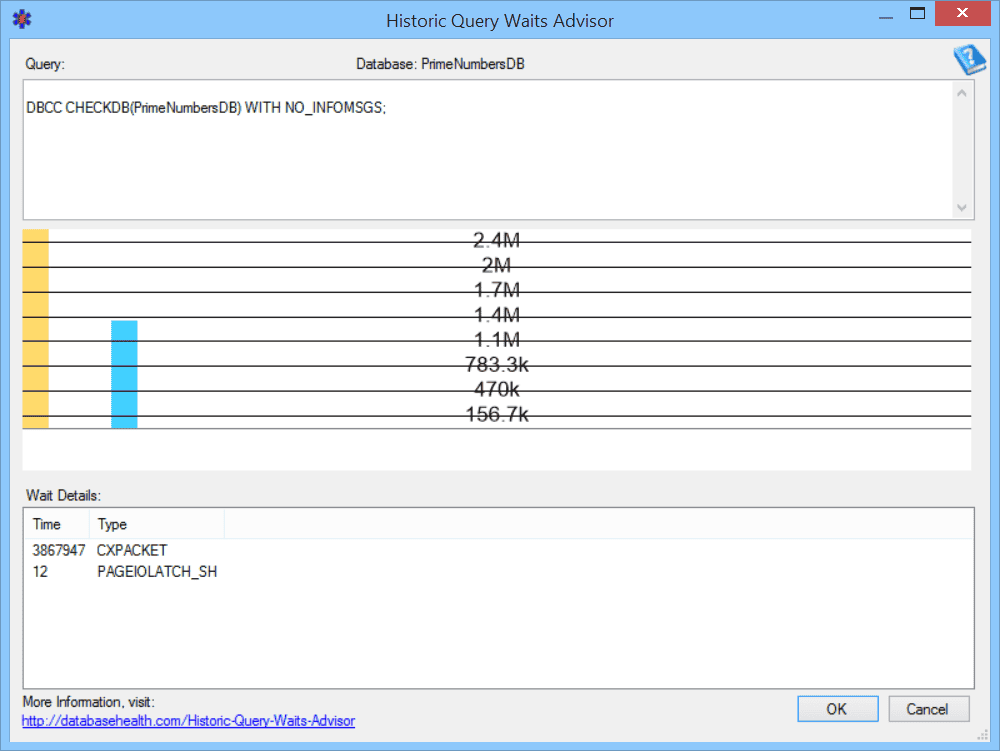
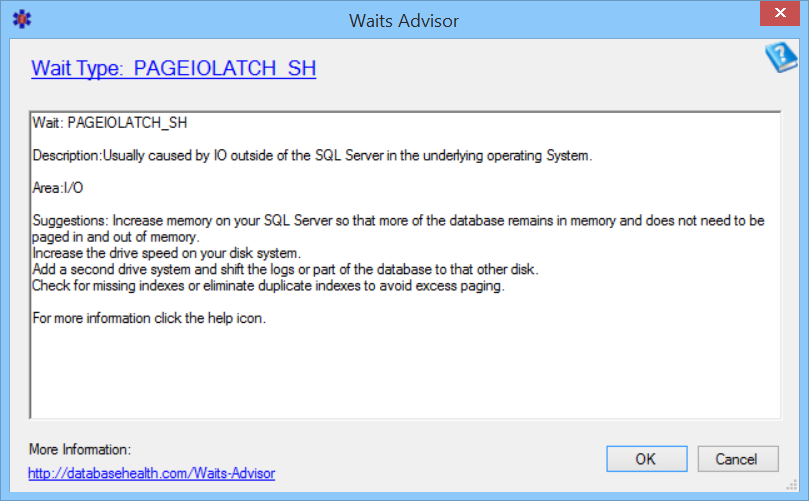
The top wait is CXPACKET, followed by PAGELATCH_SH. The CXPACKET wait type is usually benign, however it may be an indicator that you need to adjust your MAXDOP settings. Double clicking the PAGELATCH_SH wait type shows the following details with a brief explanation:
It is that quick and easy to find out what is causing waits on your SQL Server database. This works on SQL Server 2005 and newer, and has been tested on the SQL Server 2016 CTP release also.
The Historic Waits monitoring database can add 2% to 3% CPU load to your SQL Server. But most find that they can eliminate at least that much CPU and I/O by fixing problems that the Historic Waits reports expose. If you are having performance issues, usually within a week or two you can expose problems that can reduce the overall load on that SQL Server.
Database Health monitor Version 2.0 is available as a free download at http://DatabaseHealth.com, this is a free product created by Steve Stedman of Stedman Solutions, LLC.
More from Stedman Solutions:

Steve and the team at Stedman Solutions are here for all your SQL Server needs.
Contact us today for your free 30 minute consultation..
We are ready to help!
Leave a Reply