Adventureworks2012 data to Google GeoChart Visualization
There are so many cool tools available today for data visualization. This posting covers pulling data from the AdventureWorks2012 database running on SQL Server 2012, and then using the Google Visualization tools to display geographic data.
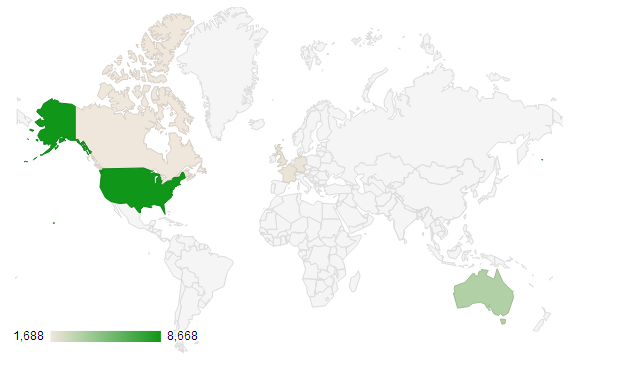
The final outcome will the this map.
People in the AdventureWorks2012 database.
Here is how I did it.
Step 1:
Create a query that generates totals for countries. I wrote the following query to pull the totals by country.
SELECT cr.name, count(1)
  FROM [Person].[Address] a
 INNER JOIN [Person].[StateProvince] sp
       ON sp.StateProvinceID = a.StateProvinceID
 INNER JOIN [Person].[CountryRegion] cr
       ON cr.CountryRegionCode = sp.CountryRegionCode
 GROUP BY cr.name;
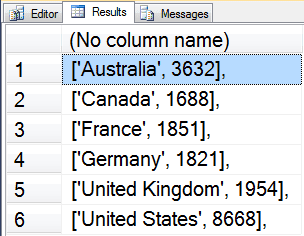
Which produced the following output.

Step 2:
Take a look at the Google code playground example at https://code.google.com/apis/ajax/playground/?type=visualization#geo_chart
Now all you need to do is replace the default list with the actual list from your query.
Step 3:
Format the query output to match the list format:
SELECT '[''' + cr.name + ''', ' + cast(count(1) as varchar(1024)) + '],'
  FROM [Person].[Address] a
 INNER JOIN [Person].[StateProvince] sp
       ON sp.StateProvinceID = a.StateProvinceID
 INNER JOIN [Person].[CountryRegion] cr
       ON cr.CountryRegionCode = sp.CountryRegionCode
 GROUP BY cr.name;
This query produces the following output.
Step 4:
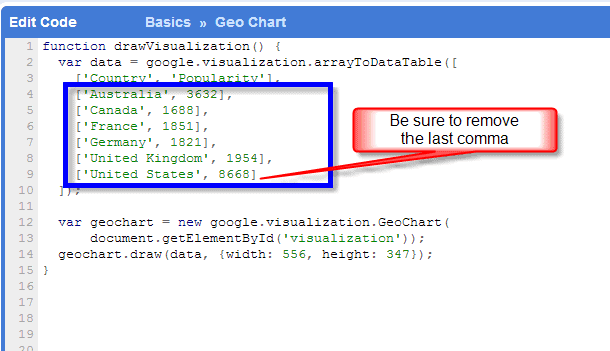
Copy and paste the data from SQL Server Management Studio into the Code Playground example, like this:
Click the run code button in the Google Code Playground, and see if your code runs. If not you will need to work out any bugs.
Step 5:
Copy the code and save it to a web page on your site. The source code will look something like this:
<!DOCTYPE html PUBLIC “-//W3C//DTD XHTML 1.0 Strict//EN” “http://www.w3.org/TR/
xhtml1/DTD/xhtml1-strict.dtd”>
<html xmlns=”http://www.w3.org/1999/xhtml”>
<head>
<meta http-equiv=”content-type” content=”text/html; charset=utf-8″ />
<title>Google Visualization API Sample</title>
<script type=”text/javascript” src=”http://www.google.com/jsapi”></script>
<script type=”text/javascript”>
google.load(‘visualization’, ‘1’, {packages: [‘geochart’]});
function drawVisualization() {
var data = google.visualization.arrayToDataTable([
[‘Country’, ‘Popularity’],
[‘Australia’, 3632],
[‘Canada’, 1688],
[‘France’, 1851],
[‘Germany’, 1821],
[‘United Kingdom’, 1954],
[‘United States’, 8668]
]);
var geochart = new google.visualization.GeoChart(
document.getElementById(‘visualization’));
geochart.draw(data, {width: 556, height: 347});
}
google.setOnLoadCallback(drawVisualization);
</script>
</head>
<body style=”font-family: Arial;border: 0 none;”>
<div id=”visualization”></div>
</body>
</html>
Here is the link to the page on my site http://stevestedman.com/samples/visualization1.html
I hope you enjoy this.
-Steve Stedman
Bellingham WA
More from Stedman Solutions:

Steve and the team at Stedman Solutions are here for all your SQL Server needs.
Contact us today for your free 30 minute consultation..
We are ready to help!


Leave a Reply