More TSQL 2012 Analytics PERCENTILE_DISC and PERCENTILE_CONT
Like the other new Analytic functions, PERCENTILE_DISC and PERCENTILE_CONT require the use of the OVER clause.
For this example I will be using almost the same revenue table in the sample database that I set up for the LEAD and LAG posting earlier in the week, and the PERCENT_RANK posting yesterday, just a few values changed to show the differences between these two functions.
CREATE DATABASE [analytics_demo];
GO

USE [analytics_demo];

-- same Revenue Table used in previous examples of the OVER clause

CREATE TABLE REVENUE
(
[DepartmentID] int,
[Revenue] int,
[Year] int
);

insert into REVENUE
values (1,20000,1999),(2,60000,1999),(3,49000,1999),
 (1,40000,2000),(2,40000,2000),(3,60000,2000),
 (1,30000,2001),(2,30000,2001),(3,700,2001),
 (1,90000,2002),(2,20000,2002),(3,80000,2002),
 (1,10300,2003),(2,1000,2003), (3,900,2003),
 (1,10000,2004),(2,10000,2004),(3,10000,2004),
 (1,20000,2005),(2,20000,2005),(3,20000,2005),
 (1,40000,2006),(2,30000,2006),(3,300,2006),
 (1,70000,2007),(2,40000,2007),(3,40000,2007),
 (1,50000,2008),(2,50000,2008),(3,42000,2008),
 (1,20000,2009),(2,60000,2009),(3,600,2009),
 (1,30000,2010),(2,70000,2010),(3,700,2010),
 (1,80000,2011),(2,80000,2011),(3,800,2011),
 (1,10000,2012),(2,90000,2012),(3,900,2012);
With these two percentile functions the main difference is that PERCENTILE_CONT interpolates the appropriate value, even if it is not in the set, and PERCENTILE_DISC picks a percentile that exists in the set. Keep in mind that any nulls in the data set are ignored. The CONT stands for continuous, and DISC stands for discrete distribution which means that the percentile will exist in the set.
Here is how they work.
First PERCENTILE_CONT to calculate the 90th percentile:
-- now on to PERCENTILE_CONT to calculate the 90th percentile
select DepartmentID, Revenue, Year,
 PERCENTILE_CONT(.9)
 WITHIN GROUP(ORDER BY Revenue)
 OVER(PARTITION BY DepartmentID) as Percentile90
 from REVENUE
order by DepartmentID;
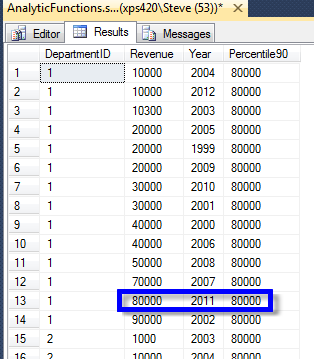
which produces these results:
From here you can see that the 90th percentile is 77000, but there is no 77000 in the set, thus the continuous distribution.
Then PERCENTILE_DISC to calculate the 90th percentile (Discrete distribution):
-- now on to PERCENTILE_DISC to calculate the 90th percentile
select DepartmentID, Revenue, Year,
 PERCENTILE_DISC(.9)
 WITHIN GROUP(ORDER BY Revenue)
 OVER(PARTITION BY DepartmentID) as Percentile90
 from REVENUE
order by DepartmentID;
From the output can can see that the 90th percentile for the Revenue at DepartmentID of 1 is 80000, meaning that 90% of the values in the set are less than or equal to 80000. Since the 90th percentile is calculated using values in the set when using PERCENT_DISC, this gives you a different value than the previous example with PERCENT_CONT.
Not on to calculating the median and comparing DISC and CONT
-- calculating the median with PERCENTILE_DISC and PERCENTILE_CONT
 -- http://stevestedman.com/?p=1533
 select DepartmentID, Revenue, Year,
 PERCENTILE_DISC(.5)
 WITHIN GROUP(ORDER BY Revenue)
 OVER(PARTITION BY DepartmentID) as MedianDisc,
 PERCENTILE_CONT(.5)
 WITHIN GROUP(ORDER BY Revenue)
 OVER(PARTITION BY DepartmentID) as MedianCont
 from REVENUE
order by DepartmentID;
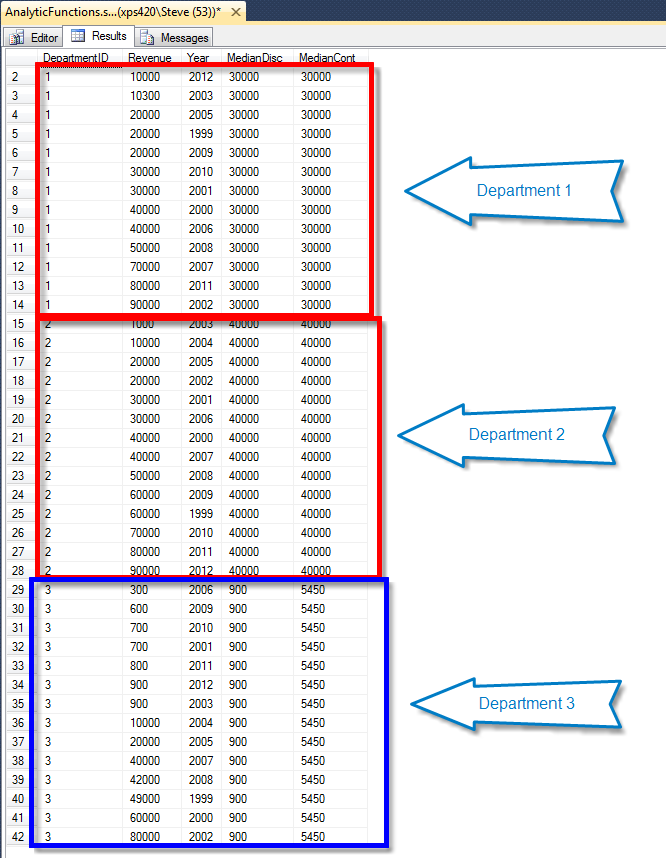
With this example you can see below that Department 1 and Department 2 have the same value for the PERCENTILE_DISC(.5) and PERCENTILE_CONT(.5), but when you look at Department 3 you can see that are very different numbers based on the distribution of this set. 
So overall the thing to remember here is the difference between CONT and DISC, in that DISC will include a number that is in your set, and that CONT may include the actual percentile even if it doesn’t fit into your set.
More blogging to come on the TSQL 2012 Analytic function CUME_DIST tomorrow.
More from Stedman Solutions:

Steve and the team at Stedman Solutions are here for all your SQL Server needs.
Contact us today for your free 30 minute consultation..
We are ready to help!


Leave a Reply