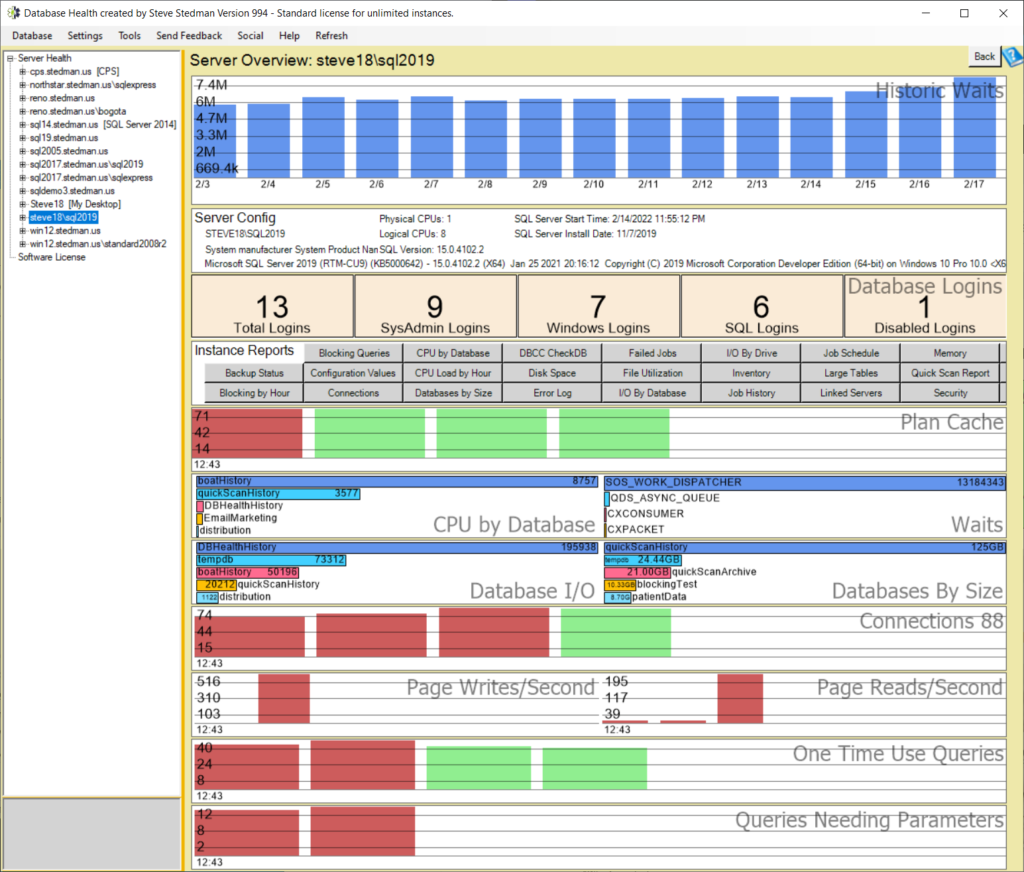
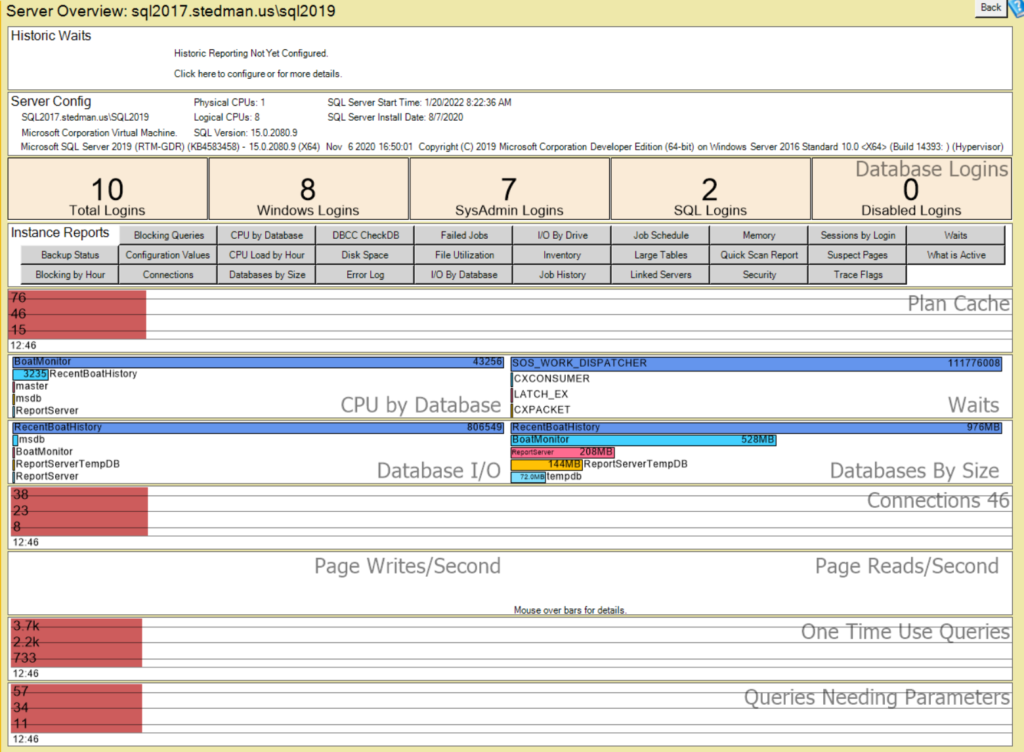
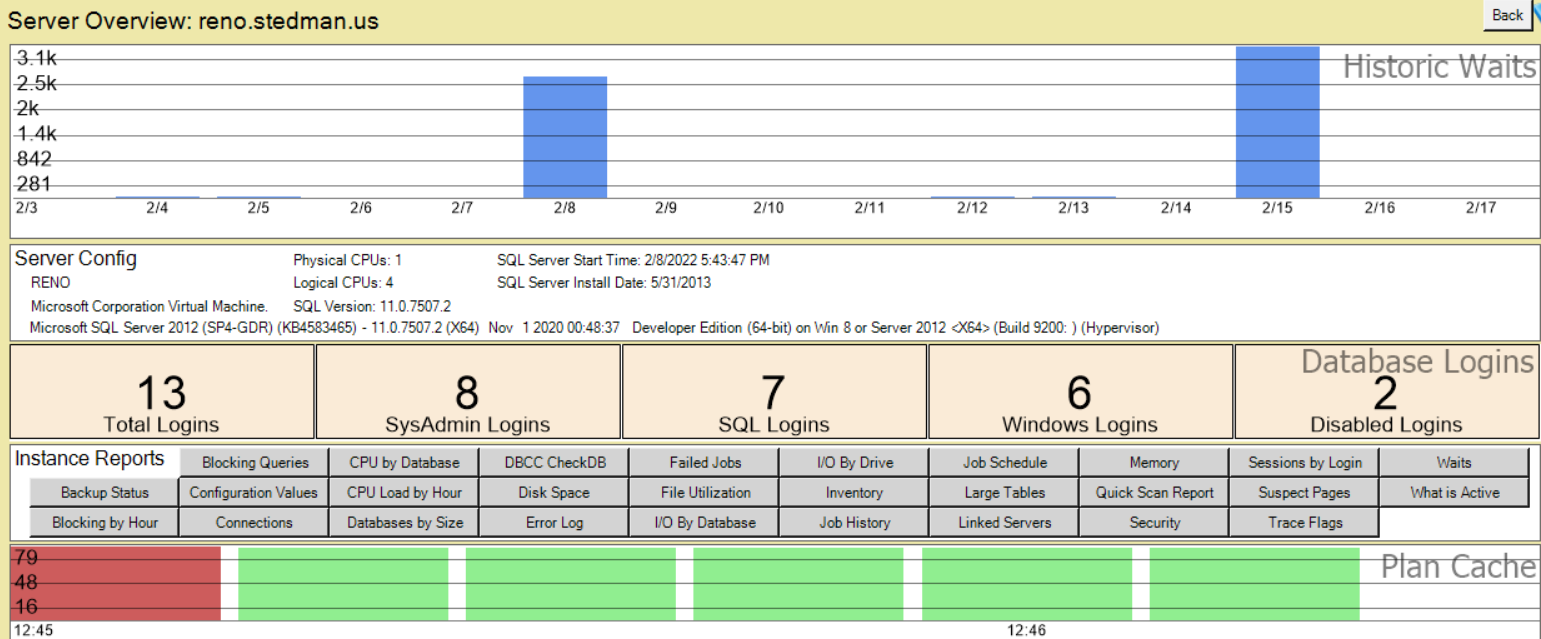
With the server overview page you can keep close tabs on some of the key performance indicators for a SQL Server. The details on this page apply not to a single database, but instead to the entire SQL Server instance.

The server overview page gives you a quick rundown of the following:
- Historic Waits
- Plan Cache
- CPU By Database
- Server Connections
- Page Writes / Second
- Page Reads / Second
- Waits
- One Time Use Queries
- Queries Needing Parameters
The gray buttons in the middle of the page are all the instance level reports. These instance reports are some of the quickest ways to evaluate the overall status of your entire SQL Server.

Also See:
- Download Database Health Monitor https://databaseHealth.com/download2
- Database Health Monitor Training Class http://stevestedman.com/dbh-school
- More information on this overview page http://databasehealth.com/server-overview/
Want to know more about Database Health Monitor and these reports?
Take a look at the class we’ve built with several hours of training videos: http://stevestedman.com/dbh-school
More from Stedman Solutions:

Steve and the team at Stedman Solutions are here for all your SQL Server needs.
Contact us today for your free 30 minute consultation..
We are ready to help!

