For years we have been able to use Transparent Data Encryption or TDE to encrypt our database files on SQL Server Enterprise Edition. This ability was the only reason many clients needed to upgrade from Standard Edition to Enterprise Edition. SQL Server 2019 includes TDE as a Standard Edition feature. No longer do you need to shell out the extra …

Transparent Data Encryption (TDE) on SQL Server 2019 Standard Edition Read more »

There is an old DBA joke, that goes something like this: You either need to have a good backup strategy, or a really good resume. But all joking aside, many people responsible for a SQL Server database find out too late that they did not have the right backup and recovery strategy. How would it feel to explain to your …

Do you have the right backup and recovery strategy? Read more »

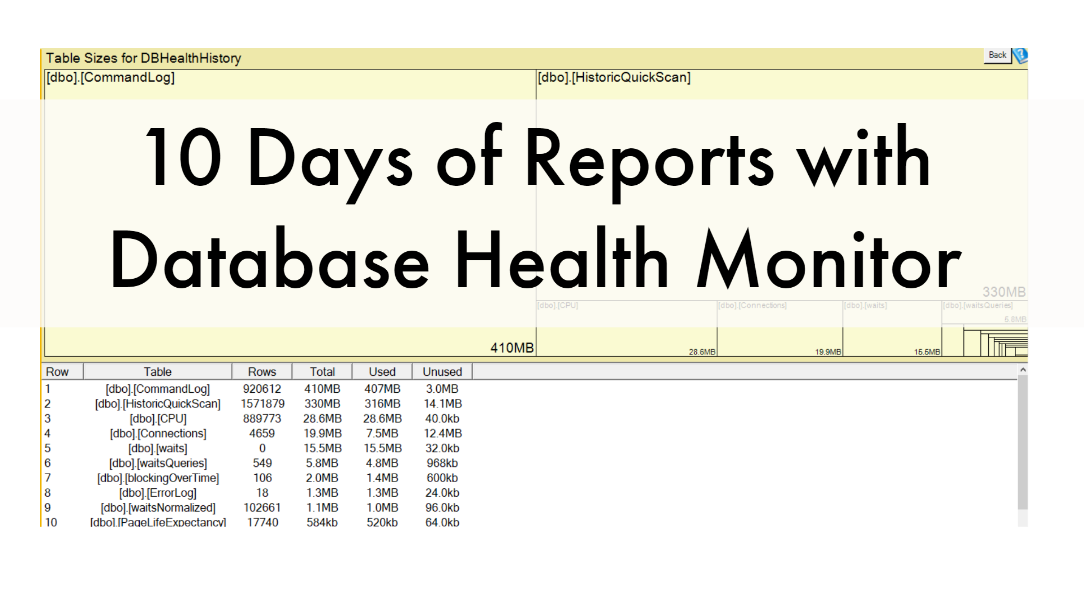
We hope you enjoyed our 10 days of Database Health Monitor Reports. We enjoy making your job easier! To it even easier we’ve created this blog post with all 10 days listed. Don’t have Database Health Monitor? Learn more about it. Day 1 – Database By Size The databases by size report is a quick and easy way to see …

10 Day of Database Health Reports Recap Read more »

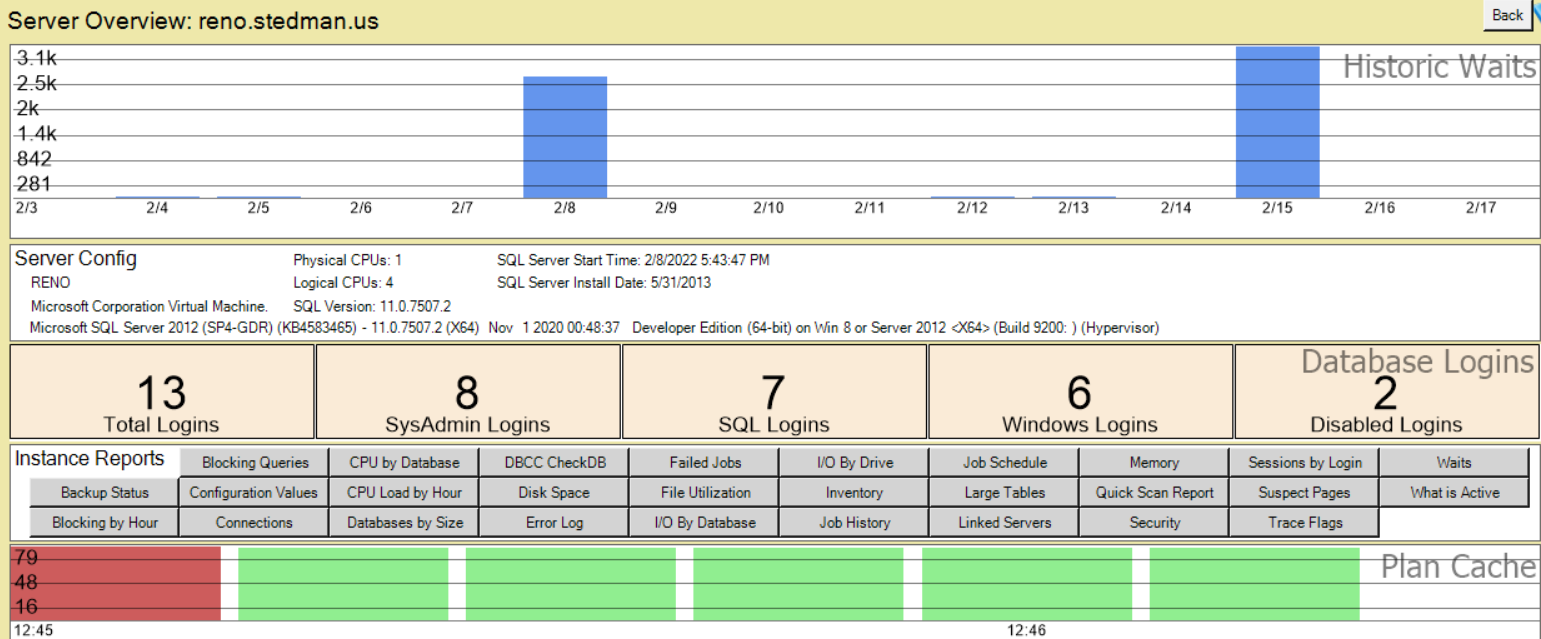
With the server overview page you can keep close tabs on some of the key performance indicators for a SQL Server. The details on this page apply not to a single database, but instead to the entire SQL Server instance. The server overview page gives you a quick rundown of the following: Historic Waits Plan Cache CPU By Database Server …

Day 10 – Server Overview Read more »

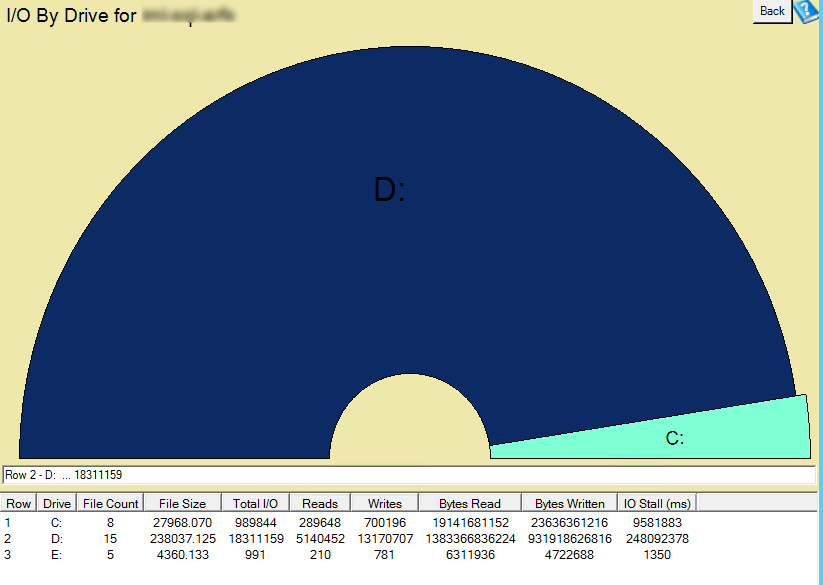
The I/0 By drive report gives you an overview of how much I/O each drive holding database or log files is using. Here is an example showing the IO by drive for a SQL server with no databases on the C Drive, and the load split between the E, F and G drives. The image below shows a SQL Server …

Day 9 – I/O By Drive Read more »

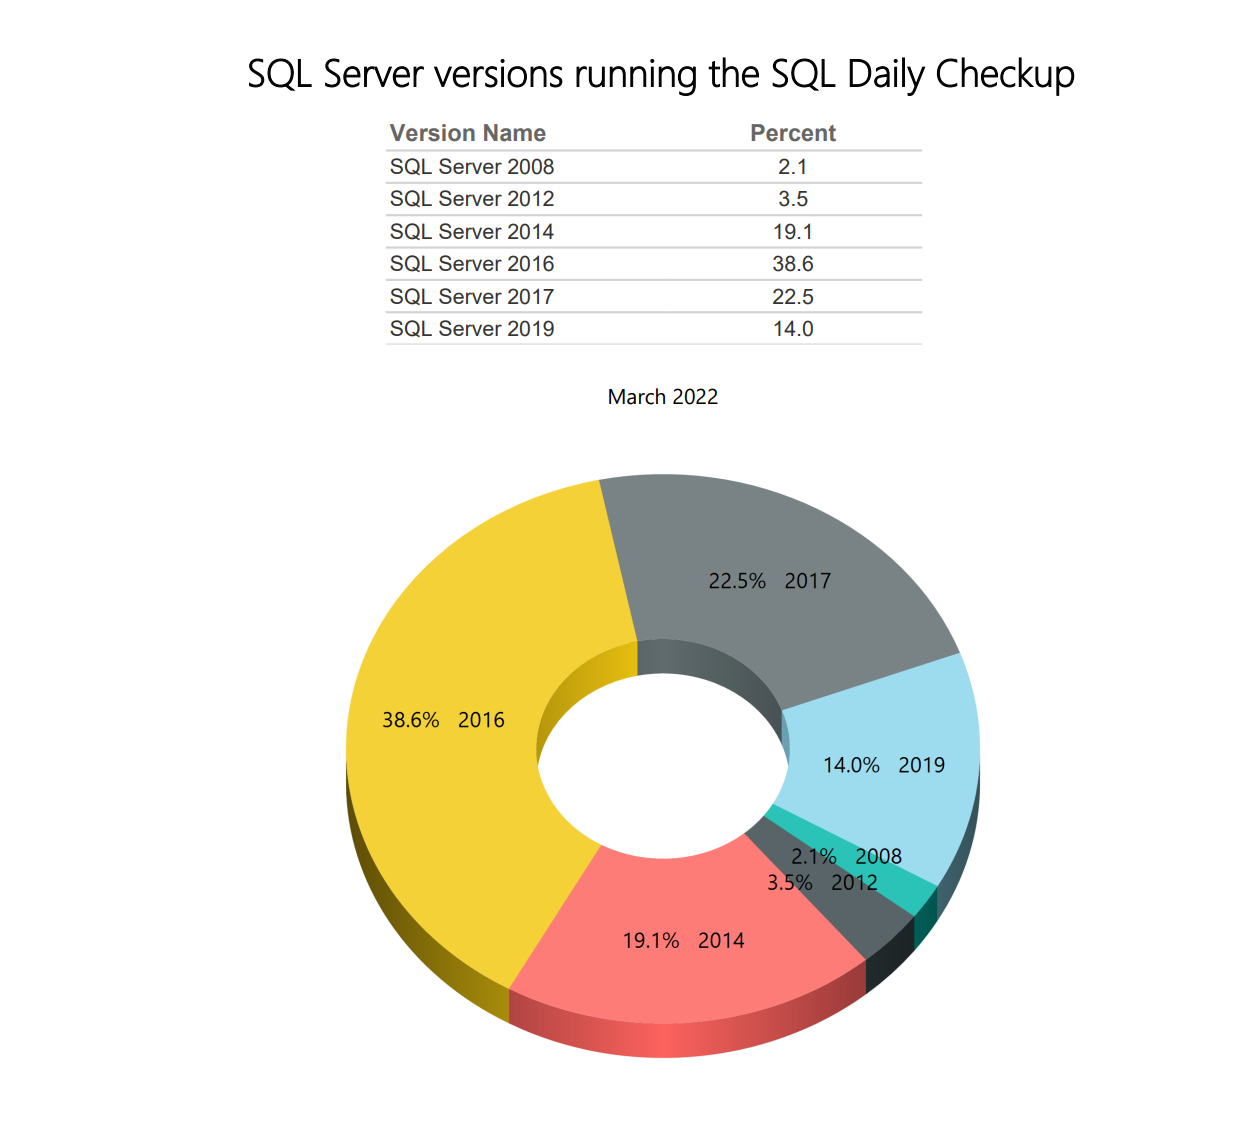
Here listed is the current percentages of SQL server versions running our Daily Check up with Database Health Monitor. Compare this month’s percentages to Last Month’s Percentages What does this post mean?? We offer a service called SQL Daily Checkup. The pie chart above represents all of our current customers using our service and what SQL Server versions they are running. What …

SQL Daily Monitoring – SQL Server Versions for March Read more »

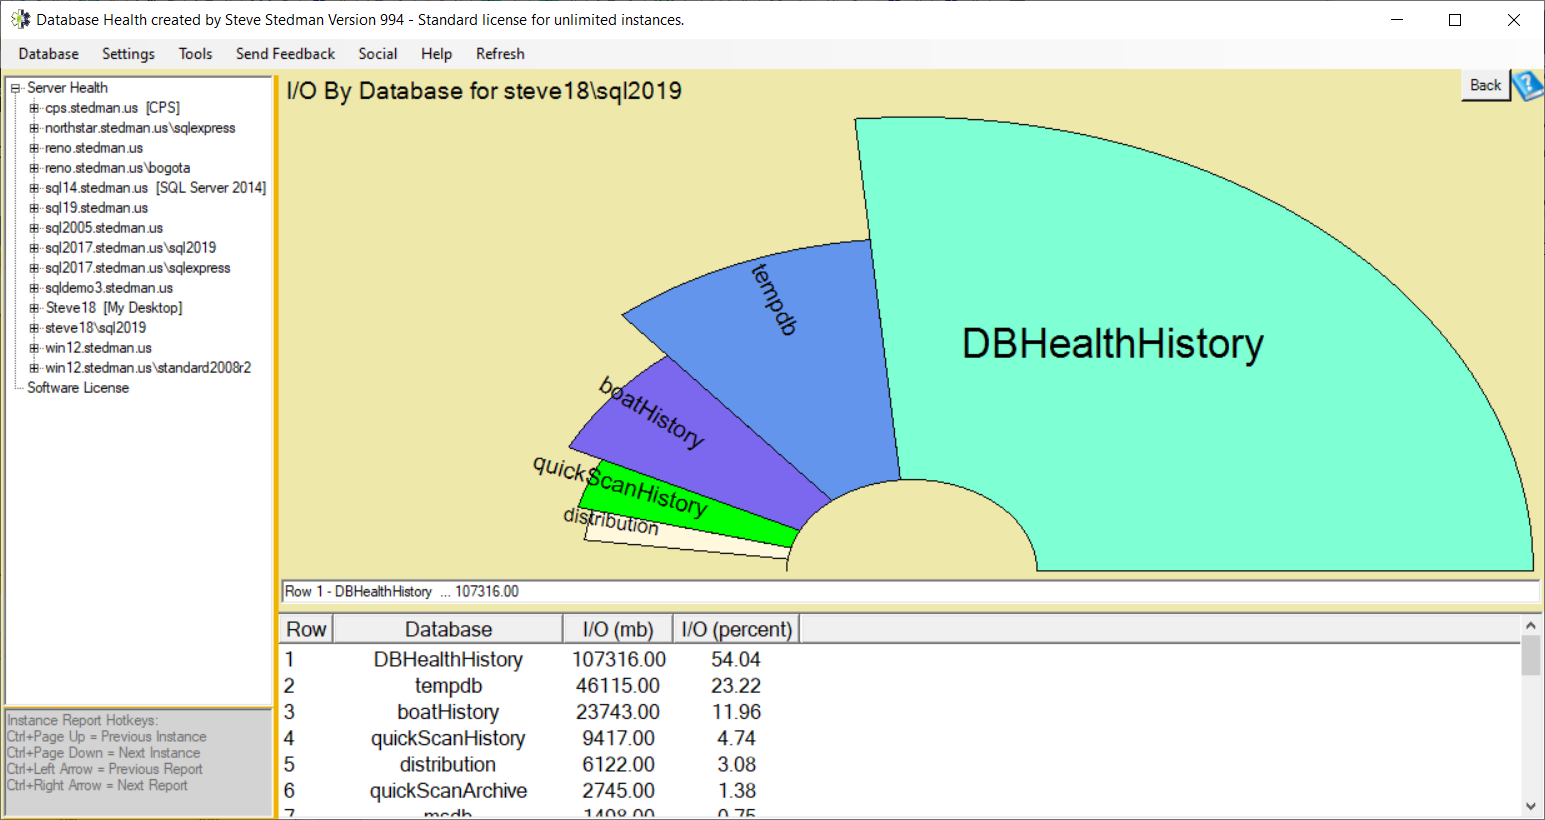
The I/O By Database report is one of the instance level reports available in Database Health Monitor. The I/O by database page shows the databases with the most IO on your system. This can be used to track down performance problems. You can get to this report either by right clicking on the instance name, and choosing instance level reports, …

Day 8 – I/O By Database Read more »

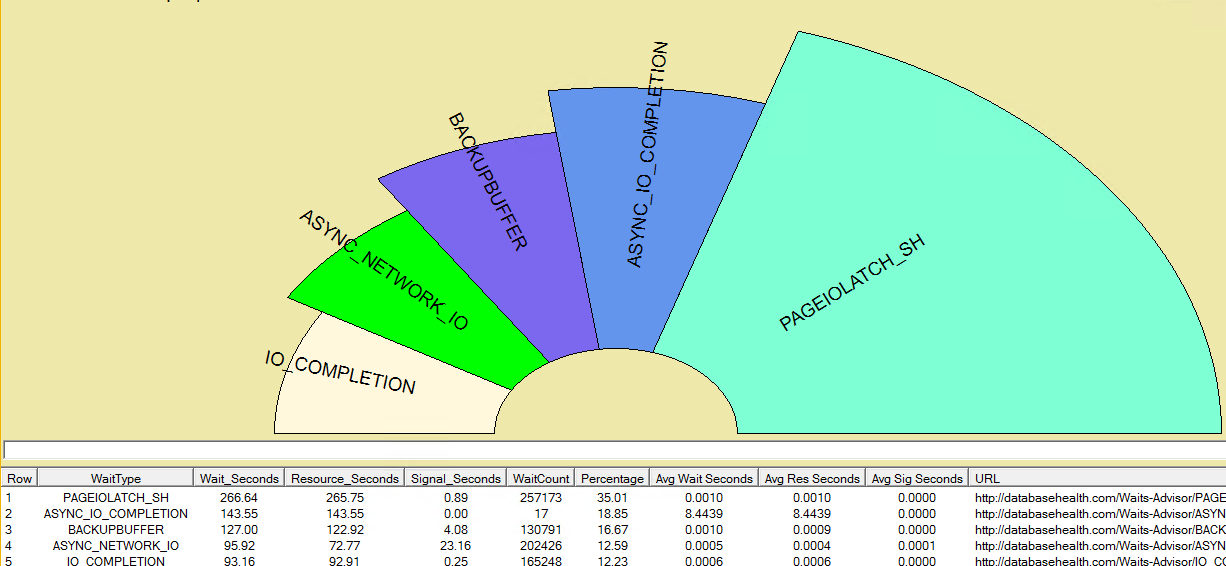
The waits by type for instance page shows you the most commonly occurring waits on your SQL Server. Grid Columns Row:  Just the row number in the grid. Type:  The name of this wait type. Wait Seconds: The total amount of time this type of wait has been waiting since SQL Server was last restarted, or since the wait stats …

Day 7 – Waits by Type for Instance Read more »

This report originally came from a customer request. They wanted to be able to export a list of all SQL Servers to another tool for managing all their SQL Server licenses. You can get to this report by going to the Server Overview page and clicking the gray button in the instance report section for “Inventory”. See Also: Download Database Health Monitor …

Day 6 – Inventory All Instances Read more »