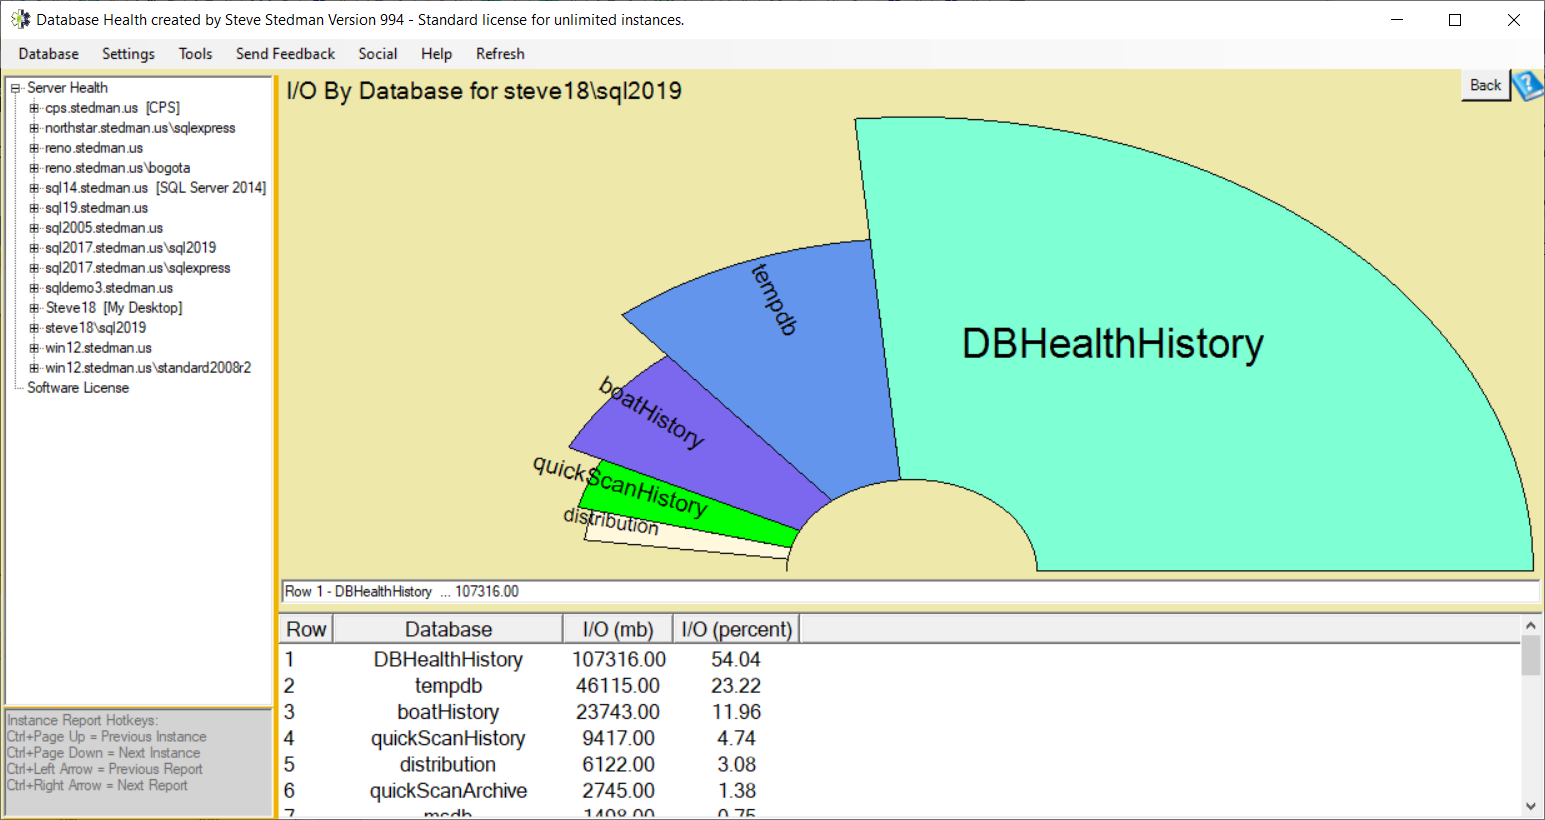
The I/O By Database report is one of the instance level reports available in Database Health Monitor. The I/O by database page shows the databases with the most IO on your system. This can be used to track down performance problems. You can get to this report either by right clicking on the instance name, and choosing instance level reports, …

Day 8 – I/O By Database Read more »

The waits by type for instance page shows you the most commonly occurring waits on your SQL Server. Grid Columns Row:  Just the row number in the grid. Type:  The name of this wait type. Wait Seconds: The total amount of time this type of wait has been waiting since SQL Server was last restarted, or since the wait stats …

Day 7 – Waits by Type for Instance Read more »

This report originally came from a customer request. They wanted to be able to export a list of all SQL Servers to another tool for managing all their SQL Server licenses. You can get to this report by going to the Server Overview page and clicking the gray button in the instance report section for “Inventory”. See Also: Download Database Health Monitor …

Day 6 – Inventory All Instances Read more »

The Blocking by Hour of the Day report is one of the instance level reports available in Database Health Monitor. Important Note:  The blocking percentages are relative for the date range shown. We find the hour that has the most blocking and use that as the maximum. All the percentages are calculated based on the percentage of the maximum blocking …

Day 5 – Blocking by Hour of Day Read more »

The SQL CPU by Hour of Day report lets you see what the average CPU load was per hour for the last week and beyond. I have used this report countless times to explain to customers what is going on with their CPU load. The SQL CPU Load by Hour of Day is an instance level report that has been …

Day 4 – CPU By Hour of Day Read more »

This report is commonly used to check in on the status of data files and log files for SQL Server. It is much quicker than right clicking on each database in SSMS and browsing to view the files. Some of the things I regularly us it for are: On SQL Server Express servers, watching to see as the datafiles approach …

Day 3 – File Utilization Read more »

10 Days of Reports with Database Health Monitor Day 2 – Table Size The Table Size report shows you the tables that are using the most disk space in your database. Many times, I’ve discovered a table in a SQL Server database that someone wanted to use to store files. That table was up taking up 98% of the entire …

Day 2 – Table Size Read more »

New SQL Server Course Release Track Blocking Queries Course Release! Using our instruction and scripts included in this course you will successfully configure email notifications when blocking occurs. Address blocking BEFORE it takes down your system. Enroll in this course for $24.99 >>> With Coupon Code >>> FEB-RELEASE50 … Read more… Day 1 – Database by Size 10 Days of …

February Blog Post Wrap-up Read more »

Track Blocking Queries Course Release! Using our instruction and scripts included in this course you will successfully configure email notifications when blocking occurs. Address blocking BEFORE it takes down your system. Enroll in this course for $24.99 >>> With Coupon Code >>> FEB-RELEASE50 Picture This Scenario Your SQL Server runs into blocking but you don’t find out until it is …

New SQL Server Course Release Read more »