Database Health Monitor -Beta Version 10.1 Released Today

Today is the release of Database Health Monitor Beta 10.1. If you haven’t see the Database Health Monitor before, its a free application that I have been building over last 4 years.
It has been a while since the last release, so I thought I would just walk through and show a few of the features.
One thing that changed right off was in the previous version, these was a advertisement for my IndieGoGo campaign where I attempted to crowd fund the next phase of development on Database Health Reports. The IndieGoGo campaign has been removed.
Real Time Reports
The real time reports are a category of reports that query the database directly to find out something that is currently happening right now. See the Historic Reports below for the ability to find out what was happening at some point in the past.
One of the new reports added is the Suspect Paged report. If you have been participating the Database Corruption Challenge you will certainly understand the value of this report.

Another new report is the Error Log Report, this is just a quick way to view the most recent entries in the current error log. The error log is not super exciting, its just an added convenience.

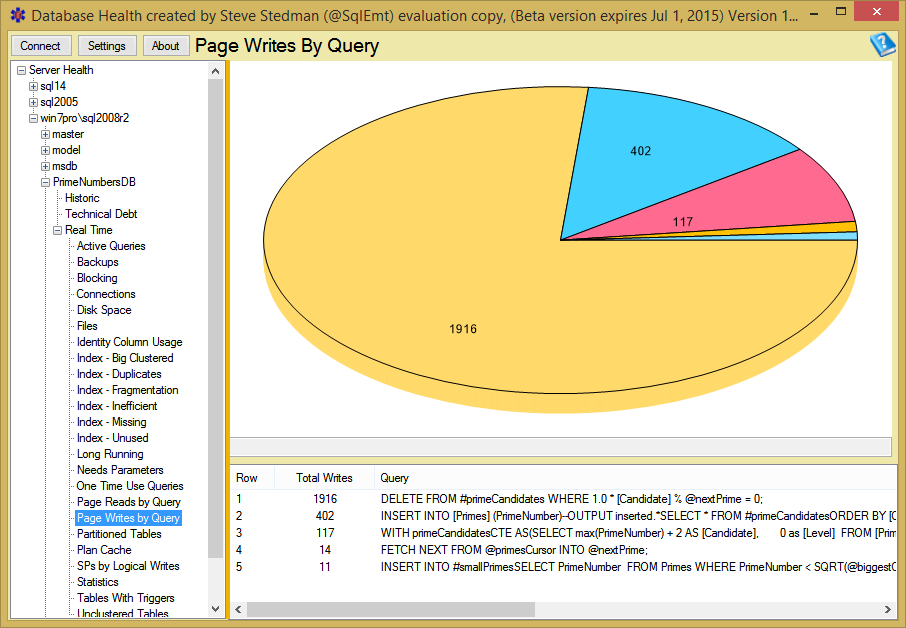
The Page Writes by Query report is one that I regularly use to find out which queries on a given database are causing the most page writes.
Historic Waits
Here is an example of the historic waits page. The historic waits is a monitoring feature, that once enabled lets you jump back to a point in time (after it was enabled) and see what was going on with your SQL Server at that point in time. For instance, if you turn on the historic reporting, on Monday, then on Wednesday someone comes to you and says “The database was slow on Tuesday at 3:45pm”, with the historic reporting, you have the ability to go back and see what was causing waits at that point in time.
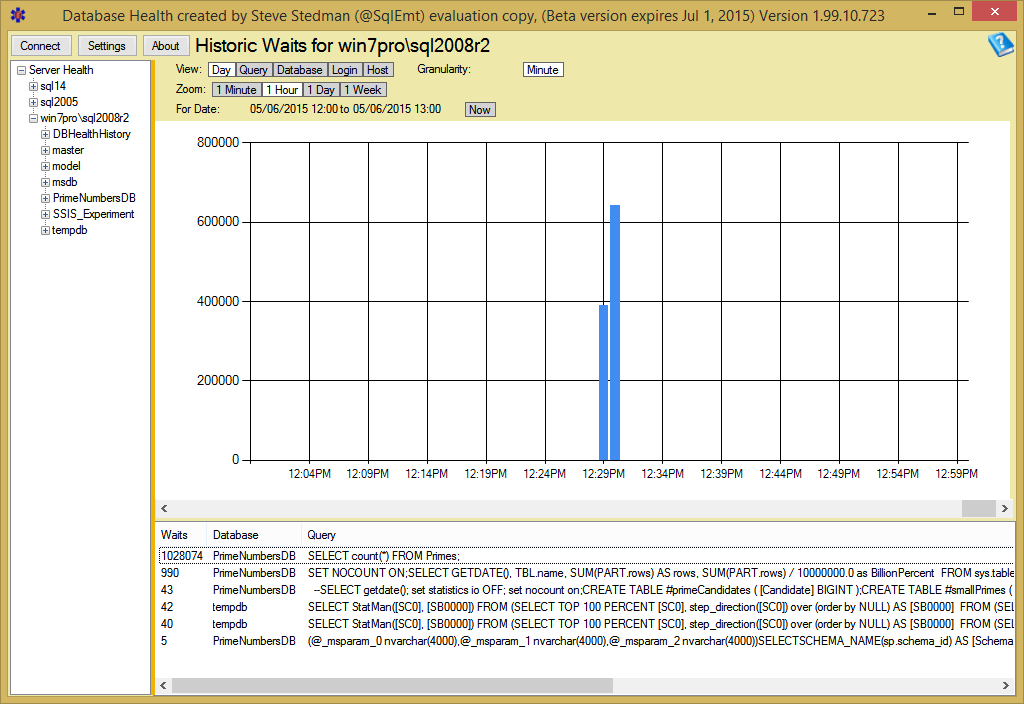
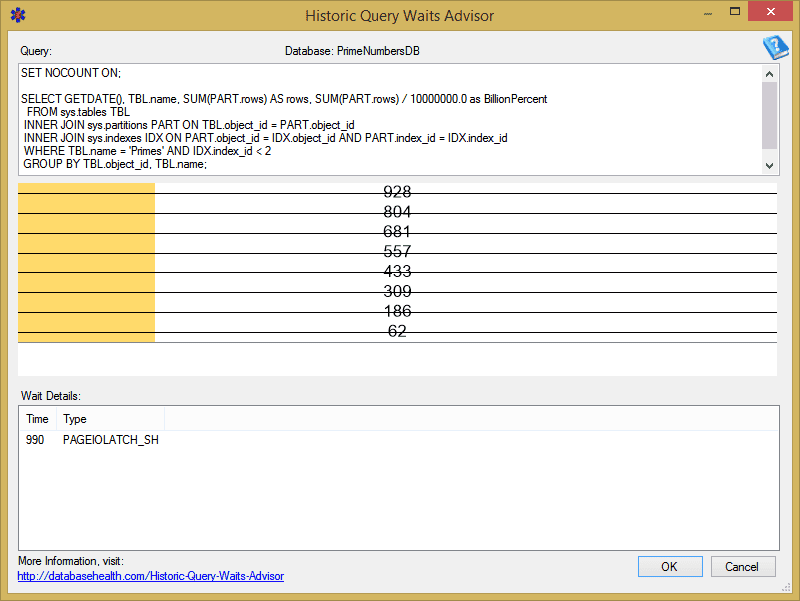
One you find a query causing waits, you have the ability to zoom in on that query, and see the exact query details, see what types of waits were occurring, and how many of them occurred.
Technical Debt
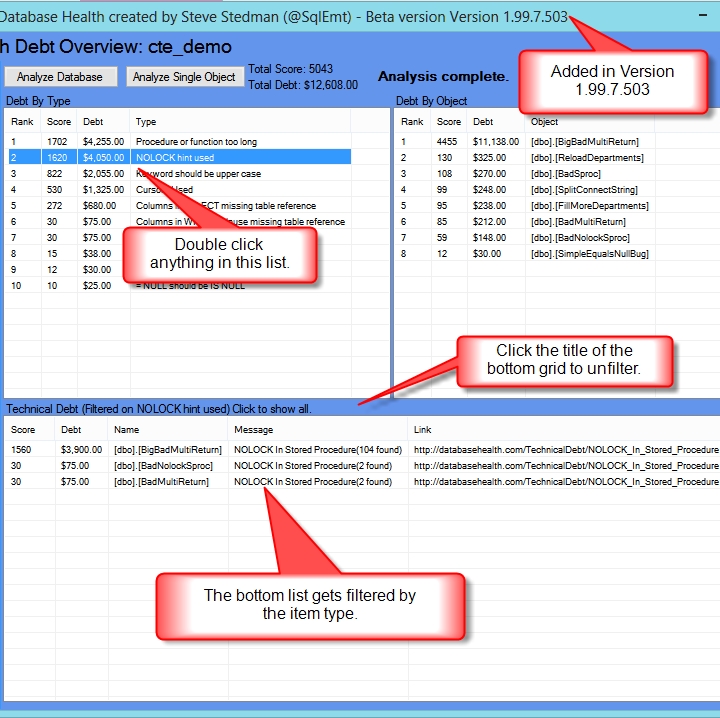
Want to find out how many sprocs are using NOLOCK hints? The technical debt section can help with this and many other anti-patterns.
Customer Raves
Here is what people are saying about Database Health Monitor.
5/6/2015 – Rave sent by email from a customer.
As I said on the FAQ for Database Health —-OUTSTANDING PRODUCT…..
You are a true, blue genius……you have done are continuing to do a GREAT job with Database Health.
2/2/2015 – Rave sent by email from a registered customer.
Thanks! It’s an amazing utility to have on hand. I’m the only DBA in our small two person IT shop but I’ve spread the word about how helpful it is.
2/2/2015 – Rave via Database Health website.
Now, I must tell you, this is one of the best tool I’ve used.
1/27/2015 – Rave via Twitter
Yavuz Filizlibay @YavuzFilizlibay Perfect program databasehealth.com thank you @DatabaseHealth @SqlEmt
1/13/2015 – Rave from Twitter
@veloceronte - San Diego, CA
Steve, just downloaded your tool. It rocks!
Free Download
Its a free download, why not try it out today.
More from Stedman Solutions:

Steve and the team at Stedman Solutions are here for all your SQL Server needs.
Contact us today for your free 30 minute consultation..
We are ready to help!
Leave a Reply