DBCC FreeProcCache

Being day 12 of the DBCC Command month at SteveStedman.com, today’s featured DBCC Command is DBCC FREEPROCCACHE.
Description:
DBCC FREEPROCCACHE is used for purge all of the parsed query plans out of memory. This is commonly used in development environments, but not as common in a production environment.
Use in a development environment is common, for instance when you are working on performance tuning, or parameterization of queries. You can clear the procedure cache with DBCC FreeProcCache, run the program or web page that may be using the database, then see what is in the procedure cache. This can be useful in finding queries that may need to be parameterized. Another way to use would be to find out what queries are being run by some program. To do this you would start by working with a database that is not being used by others, clearing the procedure cache with DBCC FreeProcCache, then run the program you are trying to figure out, then look at what is in the cache, again this is something that could be done in a development or test environment, but I wouldn’t recommend doing it in production.
Use in a production environment should be rare, this is one of the common things to try when SQL Server is having difficulty. If you are are the point that SQL Server is extremely slow to respond and you have been unable to find the cause, one thing to try is to free the procedure cache with DBCC FreeProcCache and see if that fixes the problem.
DBCC FreeProcCache Syntax:
dbcc freeproccache
[ ( @HANDLE | 'POOL NAME' ) ]
[ WITH NO_INFOMSGS ]
Example:
The following example is from a development envioronment using the AdventureWorks2012 Database.
First we connect to AdventureWorks2012 and see what is in the cache.
USE AdventureWorks2012;
GO

SELECT size_in_bytes, text
 FROM sys.dm_exec_cached_plans
 CROSS APPLY sys.dm_exec_sql_text(plan_handle) AS st;
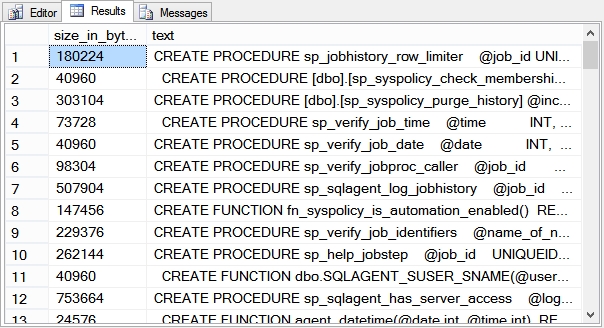
Here we see that there is plenty in the cache. Next we cleare the cache with DBCC FreeProcCache and take another look at what is in the cache.
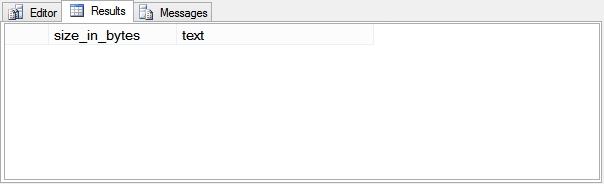
DBCC FREEPROCCACHE;

SELECT size_in_bytes, text
 FROM sys.dm_exec_cached_plans
 CROSS APPLY sys.dm_exec_sql_text(plan_handle) AS st;
After running DBCC FreeProcCache you can see that there is nothing left in the cache.
 When the very next query is run, it will need to be reparsed rather than using an already parsed query in the cache. This will take a bit longer than if there was already a parsed plan to run. Lets run 3 queries, then take a look at the cache.
GO
SELECT FirstName, MiddleName, LastName
 FROM person.Person p
 WHERE FirstName like 'John';

GO
SELECT FirstName, MiddleName, LastName
 FROM person.Person p
 WHERE FirstName like 'Mary';
GO
SELECT FirstName, MiddleName, LastName
 FROM person.Person p
 WHERE FirstName like 'Bill';
Notice the GO Statement between each query. This tells SSMS to run each query as a separate batch. Without the GO statement the 3 queries would have been parsed as a single batch.
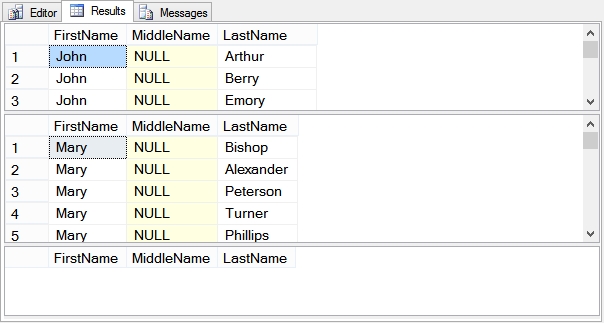
Here we see the results from the three queries. The first two returned results, and the third one had no rows in the result set. Now lets take a look at the cache
SELECT size_in_bytes, text
 FROM sys.dm_exec_cached_plans
 CROSS APPLY sys.dm_exec_sql_text(plan_handle) AS st;
Below we see a total of 20 items in the cache now. the top item highlighted in blue is the query we used to see what was in the cache, the second block highlighted in red contains the 3 queries from above, and the third rest of them are queries being run by SQL or other supporting queries. For instance line 13 is the dm_exec_sql_text which is called from the query above that checks the plan.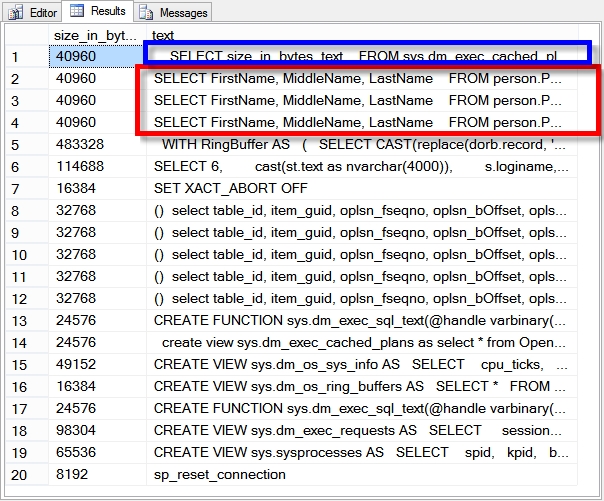
If we wanted to filter this down to just the queries we had written you could do it by adding a WHERE text LIKE … clause to the query as shown here.
SELECT size_in_bytes, text
 FROM sys.dm_exec_cached_plans
 CROSS APPLY sys.dm_exec_sql_text(plan_handle) AS st
WHERE text LIKE N'SELECT FirstName%';
Here we see that only the three queries show up, and that each of those three takes up about 40K of memory on SQL Server. 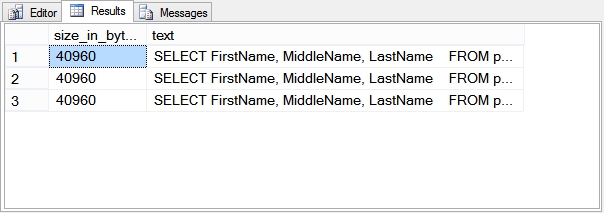 So why are there three copies of the same SELECT statement, this seems a bit wasteful. Indeed it does, for more information see an earlier post called How much Procedure Cache memory does one SQL Statement take up? There are ways to correct this.
Using DBCC FreeProcCache For A Specific Plan Handle
If you wanted to clear just a single plan handle, and not all the plan handles, you could use the optional parameter called @handle.
To get the plan handle, we start by modifying our earlier query to show us what is in the plan cache. You could leave out the WHERE clause on your own system, but I have it here to show us just the three queries in question from above.
SELECT size_in_bytes, text, plan_handle
 FROM sys.dm_exec_cached_plans
 CROSS APPLY sys.dm_exec_sql_text(plan_handle) AS st
WHERE text LIKE N'SELECT FirstName%';
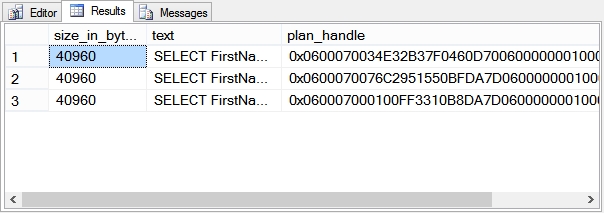
Here we see the same three query plans from earlier, with an addition column called plan_handle. To free a single plan handle, we would just copy the numeric plan handle, and add that into the DBCC FreeProcCache query.
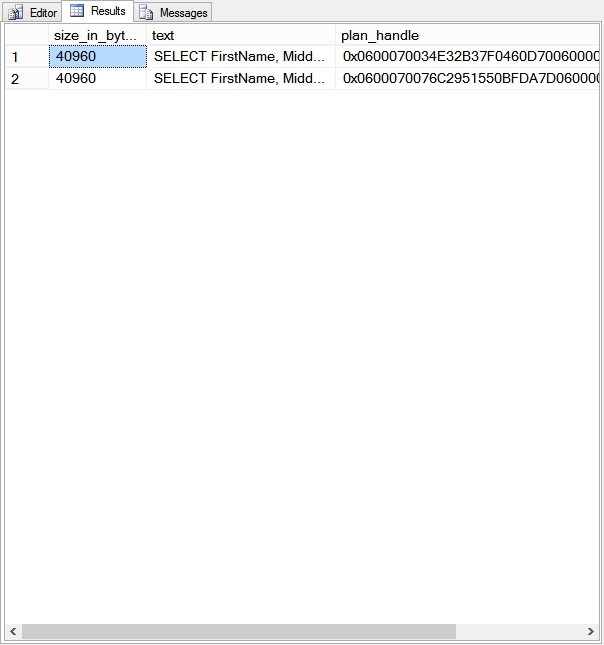
DBCC FREEPROCCACHE(0x060007000100FF3310B8DA7D0600000001000000000000000000000000000000000000000000000000000000);

SELECT size_in_bytes, text, plan_handle
 FROM sys.dm_exec_cached_plans
 CROSS APPLY sys.dm_exec_sql_text(plan_handle) AS st
WHERE text LIKE N'SELECT FirstName%';
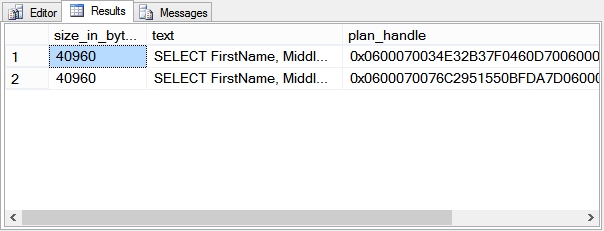
Where we only see 2 of the three original queries in the plan cache.
How big is my Procedure Cache?
You can run the following query to check the size of your procedure cache.
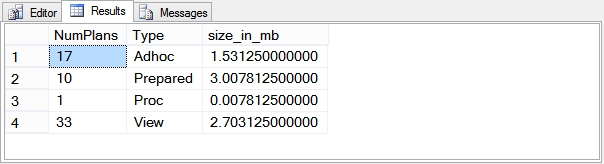
SELECT count(*) AS NumPlans, objtype as Type,
SUM(size_in_bytes)/(1024.0*1024.0) AS size_in_mb
FROM sys.dm_exec_cached_plans
GROUP BY objtype;
Which produces the following results on my test server.
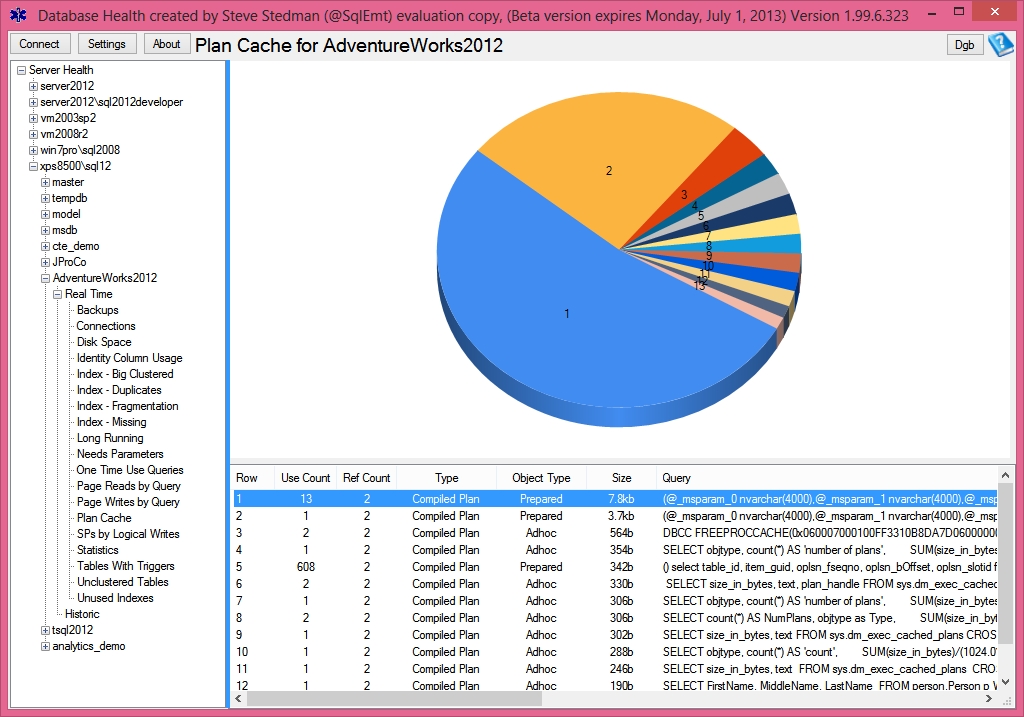
Database Health Reports and the Plan Cache
You can also view the plan cache using the Database Health Reports application as shown here.
Notes:
For more information see TSQL Wiki DBCC freeproccache.
DBCC Command month at SteveStedman.com is almost as much fun as eating jello.
More from Stedman Solutions:

Steve and the team at Stedman Solutions are here for all your SQL Server needs.
Contact us today for your free 30 minute consultation..
We are ready to help!
Thanks for the tips, the DBCC FreeProcCache did reveal that our slowdown issue was related to parameter sniffing issues. It also let us clear the issue without having to reboot the server and take down production. Unfortunately we had to clear the entire ProcCache because the single stored procedure was putting 109 items in the ProcCache when reviewing it on our Test server, because it was calling additional stored procedures. Any tips on how to determine which one of those 109 items in ProcCache is actually causing the slow down?
Eric-
The way I would go about finding the one causing the slowdown would be to use the history waits feature in the Database Health Monitor application that I have built over the last 10 years. It is available at http:\\databaseHealth.com and the historic waits feature is a great way to find the slowest queries and procedures on your system.
-Steve Stedman